Gluteus medius muscle strengthening exercise effects on medial longitudinal arch height in individuals with flexible flatfoot: a randomized controlled trial
Article information

Abstract
This study aimed to compare the effects of 8 weeks of foot plus hip exercise to foot exercise alone on medial longitudinal arch (MLA) parameters; navicular drop (ND), arch height index (AHI), plantar pressure, static balance, and dynamic balance were measured at baseline, 4 weeks, and 8 weeks. A total of 52 healthy participants with bilateral flatfoot were randomly assigned into foot exercise (n=26) and foot plus hip exercise (n=26) group. At 4 weeks, the foot plus hip exercise group showed significantly less ND (P=0.002), plantar pressure at the medial forefoot (P=0.002), and mediolateral displacement (P=0.001) while showing a greater AHI (P=0.019) than the foot exercise group. At 8 weeks, there was also significantly less plantar pressure at the medial hindfoot (P=0.017) and less anteroposterior displacement (P=0.002) in the foot plus hip exercise group than in the foot exercise group. No significant differences between groups were found in dynamic balance. The addition of gluteus medius muscle strengthening exercise to foot exercise was more effective in supporting the MLA than performing foot exercise alone.
INTRODUCTION
Flexible flatfoot is characterized by a flattening of the medial longitudinal arch (MLA) of the foot while it is in a weight-bearing position (Toullec, 2015). It is present in 13.6% to 26.6% of the adult population (Aenumulapalli et al., 2017; Pita-Fernandez et al., 2017). The condition can occur unilaterally or bilaterally (Kodithuwakku et al., 2019) and may be symptomatic or asymptomatic (Tareco et al., 1999). Individuals with flatfoot have been shown to have lower balance scores during quiet standing (Tahmasebi et al., 2015) and higher peak plantar pressure on the MLA (Buldt et al., 2018). Compared to those with a normal MLA, individuals with a flattened MLA have a higher incidence of lower extremity discomfort and injuries (Açak, 2020; Riskowski et al., 2013; Tong and Kong, 2013).
Among several interventions for alleviating flexible flatfoot, strengthening exercises for the intrinsic foot (Fiolkowski et al., 2003; Mulligan and Cook, 2013; Okamura et al., 2019) and tibialis posterior muscles (Alam et al., 2019; Smyth et al., 2017) are commonly advocated. This is due to the finding that the intrinsic foot muscles have a smaller cross-sectional area in individuals with flatfoot than in those with normal arch height (Angin et al., 2014; Fukumoto et al., 2020). While the short foot exercise is the recommended method of activating the intrinsic foot muscles, (Mulligan and Cook, 2013; Sulowska et al., 2016; Unver et al., 2020) when combined with tibialis posterior strengthening exercise, greater improvements in MLA height have been reported (Alam et al., 2019).
However, foot alignment may additionally be affected by the strength and function of proximal muscles of the lower extremity (Chuter and Janse de Jonge, 2012). With hip abductor and external rotator muscle strengthening for 6 weeks, a study on asymptomatic individuals with flatfoot showed a decrease in hindfoot eversion range of motion (Snyder et al., 2009). Isometric contraction of the hip abductor muscles for 5 sec during the short foot exercise increased intrinsic foot muscle activity more than no contraction of the hip abductor muscles (Choi et al., 2020). These findings suggest an association between hip abductor muscle strength and the MLA, with increased hip abductor strength potentially improving MLA height. It is also plausible that the addition of hip abductor strengthening exercise to the foot exercise would further improve the MLA height. However, no previous studies have investigated this notion. As the gluteus medius (GMed) is the largest hip abductor muscle, it was chosen for evaluation in this study.
The primary purpose of this study was to compare MLA height in groups performing short foot and tibialis posterior exercises with and without GMed strengthening exercise. The secondary purposes were to compare the effects of these exercises in terms of plantar pressure and balance. We hypothesized that the addition of GMed strengthening exercise to the short foot and tibialis posterior exercise regimen would elicit greater effects on the MLA height, plantar pressure, and balance.
MATERIALS AND METHODS
Study design
This study utilized a single-blinded randomized controlled trial with follow-up at 4 and 8 weeks. The study was conducted according to the consolidated standards of reporting trials guidelines (Fig. 1). The study was approved by the Research Ethics Review Committee of the University (COA No. 223/2563). All participants provided informed consent prior to participation in the study, and the rights of participants were protected.
Consolidated standards of reporting trials flow diagram.
The allocation of participants to the foot exercise group (FG) and the foot plus hip exercise group (FHG) was performed randomly using a block randomization table generated by a computerized sequence. Allocations were sequentially numbered and concealed in sealed opaque envelopes for the purpose of blinding the outcome assessor and only revealed immediately before the intervention.
Participants
A sample of convenience of participants was recruited from a physical therapy clinic and community by advertising through posters and social networks from December 2021 to December 2022. The inclusion criteria were as follows: adults aged 18 to 39 years who had asymptomatic bilateral flexible flatfoot with a navicular drop (ND) greater than 10 mm (Cote et al., 2005) and a body mass index of 18.5–22.9 kg/m2. Participants were excluded if they had undergone lower extremity surgery or had a history of trauma or accidents to the lower extremities, lower extremity deformities, or neurological conditions affecting the lower extremities.
The sample size was calculated using the IBM SPSS Statistics ver. 28.0 (IBM Co., Armonk, NY, USA) in order to detect a 1.5-mm difference in ND between groups (Alam et al., 2019). A total sample of 52 participants (26 per group) was required for a statistical power of 0.90, an alpha level of 0.05, and a drop-out allowance of 10%.
Outcome measures
Navicular drop
ND quantifies changes in navicular height in millimeters between two standing positions (Sell et al., 1994). Participants stood barefoot and the vertical distance from the most prominent palpable portion of the navicular tuberosity to the ground of each foot was measured with a ruler. Participants then stood with the subtalar joint in its neutral position, achieved by supinating and pronating the foot until the assessor could palpate the medial and lateral talar heads equally. The measurements were taken twice on each foot and the average value was recorded. From our pilot study, the intrarater reliability was found to be excellent (intraclass correlation [ICC] (3,2)=0.97).
Arch height index
Arch height index (AHI) was employed as a measure of MLA height (Butler et al., 2008). The participants stood on a block with one foot in front of the other, and a camera was placed 55 cm lateral to the foot with its focus on the navicular tuberosity (Pohl and Farr, 2010). The AHI was calculated by dividing the dorsum height at 50% of the foot length by the distance between the first metatarsophalangeal joint and the posterior heel (Pohl and Farr, 2010). The measurement was performed twice for each foot using Adobe program, and the average value was used for analysis. From our pilot study, the intrarater reliability was found to be excellent (ICC (3,2)=0.99).
Plantar pressure
Participants were asked to stand barefoot with shoulder-width apart on the DIERS Pedoscan plate (DIERS International GmbH, Schlangenbad, Germany) (Zurawski et al., 2020) for 30 sec while looking straight forward at a mark on the wall (Jonely et al., 2011). Excluding the toes, the foot plantar area was divided equally into 3 parts representing the forefoot, midfoot, and hindfoot regions. The forefoot and hindfoot were further divided into medial and lateral areas. Three measurements were taken with a 60-second rest between each measurement. The average pressure (kPa) of each foot area was used for analysis. From our pilot study, the intrarater reliability was found to be excellent (ICC (3,3)=0.96 to 0.97).
Static balance
Participants stood barefoot on the DIERS Pedoscan plate (DIERS International GmbH) (Zurawski et al., 2020) and were asked to stand on one foot, place their hands on their anterior superior iliac spines, flex their opposite knee to 90 degrees, and close their eyes (Cote et al., 2005). Three trials of 10 sec with a 60-sec rest between each trial were performed for each leg, with the left leg tested first. The displacement of the center of pressure in centimeters in the anteroposterior and mediolateral directions was obtained. The test was repeated if any of the following occurred: the other foot touched the plate or floor, the standing leg lifted off the ground, the participants’ eyes opened, or any hand left its position on the iliac crests. From our pilot study, this measurement had high intrarater reliability (ICC (3,3) of 0.75 to 0.86).
Dynamic balance
Dynamic balance was assessed using the modified star excursion balance test (Gribble et al., 2012). Four 150-cm measuring tapes were placed in a cross on the floor with the participants standing at the center of the cross. They were instructed to reach one leg with the great toe lightly contacting the tape as far as possible in the anterior, posterior, medial, and lateral directions. The distance the great toe reached from the center was recorded and calculated as a percentage of the participants’ leg length (Alam et al., 2019) which was measured from the anterior superior iliac spine to the medial malleolus. The left leg was tested first, and the reaching sequence was randomized so that half of the participants performed the test in a clockwise direction and half performed the test in a counterclockwise direction. The test was repeated if the reaching leg became weight-bearing while touching the tape, the reaching leg was unable to maintain contact with the tape for at least 1 second, or the standing leg lifted from the ground. From our pilot study, this test had excellent intrarater reliability (ICC (3,2) of 0.85 to 0.99).
Muscle strength assessment
The manual muscle testing protocol was used to assess strength of the tibialis posterior (Barn et al., 2012), flexor hallucis brevis (Yazici et al., 2020), and GMed (Soomro et al., 2022) by a handheld dynamometer. From our pilot study, an excellent intrarater reliability was found for this measurement in this study (ICC (3,3) of 0.85 to 0.97).
Interventions
Foot exercise
Three foot exercises were selected: foot adduction, foot supination, and short foot exercises. All exercises were performed 5 days per week for 8 weeks. The foot adduction and supination exercises (Fig. 2) have been found to effectively activate the tibialis posterior muscle (Kulig et al., 2004). For the foot adduction exercise, the participants sat barefoot in a chair with an elastic band positioned 45 degrees from the floor wrapped around the exercising foot. Participants adducted the foot by sliding it along the floor with the heel and toes maintaining contact with the floor against the elastic band, which was stretched approximately 15 cm from its original length, before gradually returning to the starting position. The exercise was performed for 3 sets of 30 repetitions with a 1-min rest between sets. A more resistive band was provided when the participants could perform the exercise without soreness for 1–3 days. During the foot supination exercise, the participants stood with their third to fifth toes on the edge of a step, and the foot was held in supination for 3 sec. The exercise was performed for 3 sets of 30 repetitions with a 1-min rest between sets. The short foot exercise has been found to effectively strengthen the intrinsic foot muscles (Mulligan and Cook, 2013; Unver et al., 2020). The participants were instructed to draw the metatarsal heads back towards the heel and hold the position for 5 sec without the toes curling. The short foot exercise was progressed over 3 phases, beginning in a seated position before advancing to double-leg stance and single-leg stance. Participants were progressed through the phases when they could perform the exercise without soreness for 1–3 days. The exercise was performed for 3 sets of 10 repetitions with a 45-sec rest between sets.

Foot adduction and foot supination exercises.
Hip abductor exercise
The clamshell exercise was employed to strengthen the GMed muscle (Boren et al., 2011). Four progressions were used to increasingly loading the GMed from 47% to 77% of its maximum voluntary isometric contraction. The written informed consent for publication was received from the participant in the figure (Fig. 3). Progressions 1 to 3 were performed in side-lying with the exercising leg on top, hips flexed 45 degrees, knees slightly flexed, and feet together. Progression 4 was performed with the hip in a fully extended position. All exercises in the progression were held for 5 sec and performed for 10 repetitions with a 10-sec rest between repetitions. The participants began with the exercise corresponding to their baseline muscle strength. The exercise was performed 5 days per week for 8 weeks.

Clamshell exercise. Progressions 1 to 3 were performed in side-lying with the exercising leg on top, hips flexed 45 degrees, knees slightly flexed, and feet together. Progression 1: participants externally rotated the top hip to move the top knee up and returned to starting position. Progression 2: participants kept knees together while internally rotating the top hip and returned to starting position. Progression 3: participants raised the top thigh parallel to the floor and lifted the foot toward the ceiling causing the hip to internally rotate before returning to starting position. Progression 4: participants performed the same exercise as progression 3 but with the top hip fully extended.
Procedures
At baseline, all outcome variables were assessed in the following order: ND, AHI, plantar pressure, static balance, dynamic balance, and muscle strength. A training session was conducted to teach the participants to perform the exercises correctly and ensure that they understood the progressions. Participants practiced the home exercises and were contacted every week via mobile phone or social media to ensure correct performance and provide instructions for exercise progression. Participants were provided a pamphlet with explanations of the exercises to follow over the 8-week period and a logbook to record their compliance with the exercise regimen. All participants were required to attend the clinic 3 times—at baseline, 4 weeks, and 8 weeks—to obtain outcome measures and review the exercises. Two physical therapists were involved in this study. The first, blinded to the participants’ group allocation, conducted the assessments of demographic details and all outcome variables. The second was responsible for training the participants to perform their assigned exercises and contacting the participants to follow-up on exercise performance and compliance.
Statistical analysis
Continuous variables were expressed as means and standard deviations while discrete variables were expressed as frequencies and percentages during descriptive analysis. Data normality was verified using the Shapiro–Wilk test, and an independent samples t-test was calculated to determine baseline between-group differences. Comparisons of all outcome measures between groups over time (baseline, 4 weeks, and 8 weeks) were performed using two-way mixed model measures analysis of variance (ANOVA). Where significant interactions existed between group and time, post hoc pairwise comparisons were adjusted for multiple comparisons using one-way repeated measures ANOVA and the Bonferroni procedure. Statistical analysis was conducted using IBM SPSS Statistics ver. 28.0 (IBM Co., Armonk, NY, USA) and a P-value of less than 0.05 was considered statistically significant.
RESULTS
All 52 participants completed the 8-week intervention. Twenty-six participants were female (11 in FG and 15 in FHG). The participants’ baseline demographics and characteristics are presented in Table 1. Both groups demonstrated no significant differences between feet in all outcomes measured at baseline (P>0.05), allowing the data from both feet to be combined within each group. There were no significant between-group differences at baseline for all outcome variables (P>0.05). There was a high degree of adherence to both interventions. Of the 40 days of the intervention, participants in the FG and FHG performed the exercises an average of 36.2 days and 35.7 days, respectively.

Outcomes measured at baseline when the data from both feet of each group were combined
As two-way mixed model measures ANOVA showed significant interactions between group and time for all outcomes, post hoc analyses were conducted. Most outcomes at 4 and 8 weeks changed significantly from baseline (P<0.001) (Table 2). GMed strength in the FHG increased significantly from baseline and was significantly greater than GMed strength in the FG at 8 weeks (P<0.001). At 4 weeks, the FHG showed significantly less ND (P=0.002), plantar pressure at the medial forefoot (P=0.002), and mediolateral displacement (P=0.001) while showing a significantly greater AHI (P=0.019) than the FG. These significant between-group differences were also found at 8 weeks. Significantly less medial hindfoot pressure (P=0.017) and anteroposterior displacement (P=0.002) were found in the FHG than in the FG at 8 weeks. No significant between-group differences in dynamic balance were found.
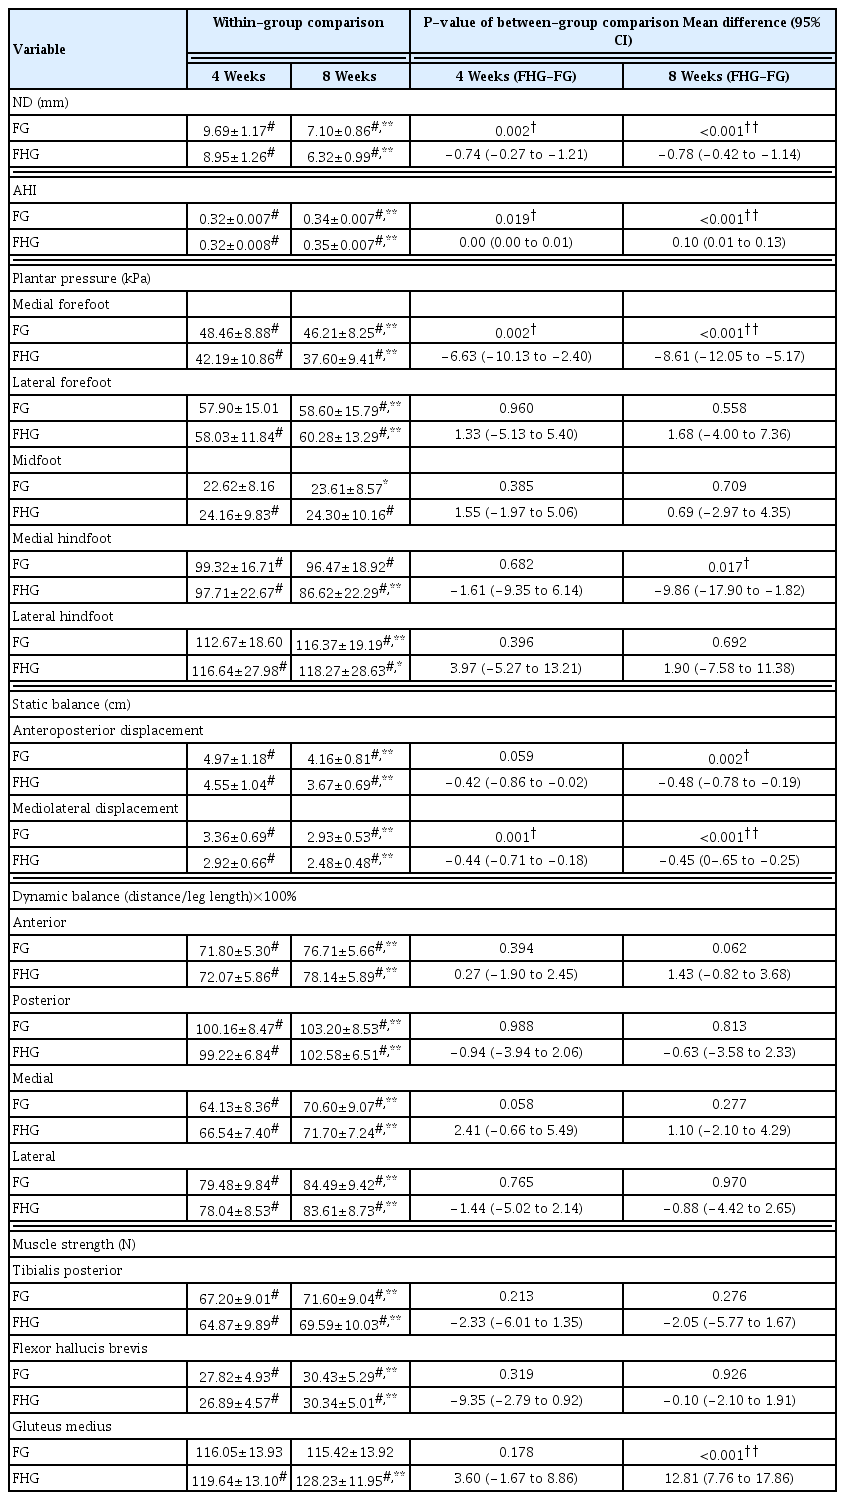
Outcome measures at 4 weeks and 8 weeks and the results of the two-way mixed model analysis of vairans of within-group and between-group comparisons (FG, n=52 feet and FHG, n=52 feet)
DISCUSSION
This study investigated the effects of GMed strengthening exercise on participants with flexible flatfoot. The results suggest that the addition of GMed exercise to short foot and tibialis posterior exercises was more effective than performing foot muscle exercises alone in all outcome measures except dynamic balance. The significant differences between groups in most outcome measures were observed after 4 weeks of the intervention. These findings support the use of GMed exercise in individuals with flexible flatfoot.
The decreased ND observed as a result of the intervention in this study supports the role of the intrinsic foot and tibialis posterior muscles in the maintenance of the MLA reported by previous studies (Mulligan and Cook, 2013; Okamura et al., 2020; Otis and Gage, 2001; Unver et al., 2020). Both the FG and FHG showed significant decreases in ND at 4 weeks, with further decreases at 8 weeks. ND after both interventions was in the range of normal arch height of 5–9 mL (Cote et al., 2005). However, the lower ND value in the FHG (6.32 mL) than in the FG (7.10 mL) after the 8-week period suggests a more rapid improvement in MLA height with the addition of GMed exercise.
Along with improved ND, the AHI in standing increased significantly from baseline with both interventions. As this value was calculated by normalizing to the participants’ foot lengths, it might be a better representation of the MLA. At 4 weeks, while the AHI was improved, both groups demonstrated AHI values of less than 0.33, which is considered the criterion for a low-arched foot (Hillstrom et al., 2013; Xiong et al., 2010). However, at 8 weeks, the FHG was closer than the FG to the AHI value of 0.36 required for normal arch height (Hillstrom et al., 2013; Xiong et al., 2010). This result substantiates the impact of GMed strength on MLA height.
Both groups demonstrated alterations in plantar pressure distribution towards the distribution of the normal-arched foot. Medial forefoot and medial hindfoot pressures decreased while lateral forefoot and lateral hindfoot pressures increased at 8 weeks. The FHG showed significant changes from baseline in all foot regions after 4 weeks of exercise, which was a faster change than that seen in the FG. Our results are consistent with the findings of previous studies, in which the plantar pressures of the medial forefoot and medial heel were reduced after the application of the adhesive tape that lifted the MLA height (Newell et al., 2015; Vicenzino et al., 2007). Comparisons between groups in this study found significantly greater pressure reductions at the medial forefoot and medial hindfoot in the FHG compared to the FG. These findings support the association between GMed strength and MLA height, potentially due to the improved lower extremity alignment caused by greater GMed strength, placing the intrinsic foot muscles in a better position to effectively support the MLA (Choi et al., 2020).
During single-leg standing, both the FG and FHG demonstrated less mediolateral and anteroposterior displacements in the center of pressure. These results coincide with a previous study that observed a reduction in sway area during single-leg stance after 5 weeks of short foot exercises (Kim and Lee, 2020). The smaller displacement seen in the FHG compared to the FG supports the concept that weight-bearing stability involves proximal joints of the lower extremity (Chuter and Janse de Jonge, 2012).
Dynamic balance improved in all directions in the FG and FHG at both 4 weeks and 8 weeks in the present study, consistent with the recent meta-analysis that also demonstrated the benefit of intrinsic foot exercise on dynamic postural balance (Wei et al., 2022). The addition of tibialis posterior exercises to short foot exercises for the intrinsic foot muscles might result in greater improvements in dynamic balance, as reported in a previous study that added tibialis posterior exercises to the toe curl exercise and showed improved dynamic balance in all directions when compared to performing the toe curl exercise alone (Alam et al., 2019). However, the nonsignificant differences in dynamic balance between the FG and FHG groups in this study might suggest that GMed exercise does not have an additional effect.
This study has some limitations. First, the study was performed on a sample comprising only asymptomatic adults with flatfoot; thus, the results are not representative of the painful flatfoot population. Future research might assess this intervention in a therapeutic population to assess if the changes in MLA parameters caused by the combination of hip and foot exercises reduce pain caused by flatfoot. Second, the study did not assess lower extremity alignment. Future studies should investigate whether lower extremity alignment changes as a result of these exercises.
In conclusion, the results of this study suggest that the addition of GMed strengthening exercise to foot exercises is more effective in decreasing ND and medial plantar pressure and increasing AHI and static balance than performing foot exercises alone in individuals with flexible flatfoot.
ACKNOWLEDGMENTS
This study was funded by the 100th Anniversary Chulalongkorn University Fund for Doctoral Scholarship.
Notes
CONFLICT OF INTEREST
No potential conflict of interest relevant to this article was reported