Match activity profile of professional female soccer players during a season
Article information

Abstract
It is necessary to understand movement characteristics of elite female soccer players during a match to develop effective training program. The purpose of this study is to analyze the physical demands of Korean female professional soccer players during a competitive season. Twenty-four female professional players (age: 27.8±3.9 years; height: 165.7± 5.1 cm) from a team, belonging to the women’s professional soccer league in South Korea participated in the study. The players participated in 11 home matches and 10 away matches from April 26 to November 9 of the 2011 season. Body weight and body mass index decreased during the first half-season compared to the preseason (P<0.05), and the decreased values were maintained until the second half-season. Total distance covered by the players was more than 9.5 km per match. No difference was found in the total distance, movement distance by exercise intensities, number of sprints and accelerations, and maximum speed between the first half- and second half-seasons. Midfielders covered the most distance during a match compared to other positions (P<0.05). Wing forward covered the most distance of high-intensity exercise. Maximum speed during the match was higher among wing forward and forward than in other positions (P<0.05). There were no significant differences between home and away matches in all variables (P>0.05). In conclusion, in order to improve the performance of female soccer players and prevent injuries, a training program should be constructed that considers the characteristics of each player and playing position rather than uniform training in a team.
INTRODUCTION
In order to improve exercise performance of soccer players during a match, a scientific and systematic training program should be applied. Various studies have been conducted to develop an effective training program (Kent et al., 2021; Kotzamanidis et al., 2005; Noyes et al., 2013). Intermittent movement, which is specific to soccer, is the most basic factor to consider when composing a training program for soccer players. Changes in direction performed by players during a soccer match amounts to 412–556 times (Granero-Gil et al., 2020). The players’ exercise performance may be influenced by the tactical characteristics pursued by the team. For example, high-intensity running distance covered in matches with ball possession is higher in high percentage ball possession teams compared to low percentage ball possession teams (Bradley et al., 2013). Therefore, in advance, it is crucial to understand the movement of players during a match in order to construct an effective training program.
Soccer players play a large number of games during a season, which lasts approximately nine months. The period of a season usually consists of preseason, beginning, middle, and end of season (Silva et al., 2013). Various studies have analyzed the changes in players’ performance during a season. Injuries to elite soccer players occur more frequently at the end of a season than at the beginning and middle of a season (Morgan and Oberlander, 2001). Exercise performance decreases at the end of a season due to accumulation of such injuries or fatigue, particularly, high-intensity exercise performance is greatly affected by season (Kraemer et al., 2004). Additionally, players’ exercise performance may be different in the first and second half of a match. It was observed that the total running distance and distance run at high intensity were higher during the first half of a match when compared to the second half. Due to accumulated fatigue towards the end of a match, players’ exercise performance may be different in the first and second halves of a match. It is observed that the total running distance and high-intensity running are higher in the first half when compared to the second half (Rampinini et al., 2007).
The movements of soccer players differ, depending on their playing positions (Bloomfield et al., 2007). Depending on the tactical characteristics pursued by the team, the movement pattern in each position may differ, but the ratio of performance by exercise intensities according to position is similar in most national soccer leagues (Dellal et al., 2010; Dellal et al., 2011). The position that covers the most distance during a match is the midfield, followed by defense and forward positions (Vigne et al., 2010). The wide midfielder covers the most distance of high-intensity exercise, such as sprints, and the wide midfielders and defenders located on the side of the pitch covers more distance during sprint compared to midfielders and defenders located at the center of the pitch (Di Salvo et al., 2009). The cause of this difference according to playing location even within the position may be related to difference in exercise performance required for tactical situations, such as overlapping and counter attack during a match.
Although the popularity of women’s soccer is lower than that of men’s soccer, it has increased a lot compared to that in the past. The number of studies on women’s soccer is increasing with an increase in popularity of women soccer. The performance ratio of each intensity exercise, such as standing, walking, jogging, high-intensity running, and sprint during women’s soccer match is similar to that of men’s soccer players (Fessi et al., 2016; Mohr et al., 2008). Despite the fact that women soccer players have less muscle mass than men soccer players biologically, high-level female soccer players cover a total of 9.5–11 km during a match (Datson et al., 2017). The magnitude of exercise performance according to exercise intensities during a match may vary, depending on the level of the players. High-intensity exercise can be important according to tactical characteristics, including strong pressure in high-level competitions, such as national competitions. Therefore, as a result of comparing the amount of high-intensity exercise during matches, national team players perform more high-intensity running and sprinting than professional league players (Mohr et al., 2008). Even for such a high-level female soccer player, high-intensity exercise performance decreases toward the end of the second half (Datson et al., 2017).
Most of the studies on the exercise performance of soccer players during a game have been conducted in European countries. In order to develop a training program to prevent injuries and improve performance of Asian female soccer players with different physical characteristics such as height and weight, it is necessary to understand their exercise performance characteristics during a match. Therefore, the purpose of this study is to analyze the physical demands of Korean female professional soccer players during a competitive season.
MATERIALS AND METHODS
Participants
Twenty-four female professional players from a team, belonging to the women’s professional soccer league in South Korea participated in the current study (age: 27.8±3.9 years; height: 165.7± 5.1 cm). Only players who played more than 85 min of a 90-min league match were selected. Goalkeepers were excluded because of relatively low activity due to the nature of their position during a match. The positions were divided into center back (CB), full back (FB), midfielder (MF), wing forward (WF), and forward (FW). The players participated in 11 home matches and 10 away matches out of a total of 21 matches from April 26 (first round) to November 9 (last round) of the 2011 season. The season was divided into first half-season (14 matches: April to July) and second half-season (7 matches: August to November) with approximately four weeks break period. Changes in body composition parameters in the players were assessed 3 times during the season (pre-, first half- and second half-seasons) using multifrequency bioelectrical impedance analysis (InBody 720, Biospace, Seoul, Korea).
Match analysis data
Match activities were analyzed using a global positioning system (GPS) at 10 Hz, including a tri-axial accelerometer sampling at 100 Hz. The players wore GPS-only vests before warm-up, and the GPS units were fitted between the upper scapulae. Units were activated 10 min before each match and turned off immediately following the match, in accordance with the manufacturer’s instructions. The players were provided the same GPS device throughout the season to avoid interunit variability. The following match activity categories were applied: walking (0–7 km/hr), low-intensity running (7.1–13 km/hr), moderate-intensity running (13.1–19 km/hr), high-intensity running (19.1–23 km/hr), and sprinting (>23.1 km/hr). The total distance was calculated as the sum of distances of all types of activities during a match.
Statistical analysis
All statistical analyses were performed using SPSS ver. 17.0 (SPSS Inc., Chicago, IL, USA). All values are expressed as mean values±standard deviation. A one-way analysis of variance and repeated measures analysis of variance was used to compare the distance covered according to playing positions and changes in body composition. When a significant F-value was found, the Bonferroni post hoc analysis was used to determine which groups differed significantly. Independent t-test was applied to compare the difference between groups. Eta-square (one-way analysis of variance [ANOVA]), partial eta-square (repeated ANOVA) and Hedges’g (t-test) were calculated to estimate the effect size (ES). Significance level was set at P≤0.05.
RESULTS
Changes in body composition
Body weight (ES=0.16) and body mass index (BMI, ES=0.15) decreased during the first half-season compared to the preseason (P<0.05), and the decreased values were maintained until the second half-season. However, there was no statistically significant change in muscle mass and body fat percentage (ES=0.06) according to the period of seasons (Table 1).
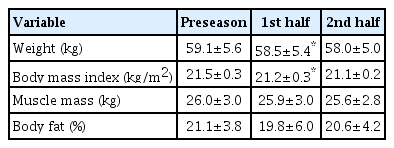
Changes in body composition
Match performance between the first and second half-season
The female soccer players covered more than 9.5 km of distance per match. No difference was found in the total movement (ES= 0.09), movement distance by exercise intensities (ES rage of 0.04–0.27), number of sprints (ES=0.25) and accelerations (ES=0.27), and maximum speed (ES=0.20) between the first half- and second half-seasons. However, the number of decelerations (ES=0.43) was significantly lower in the second half-season than in the first half-season (P<0.05) (Table 2).
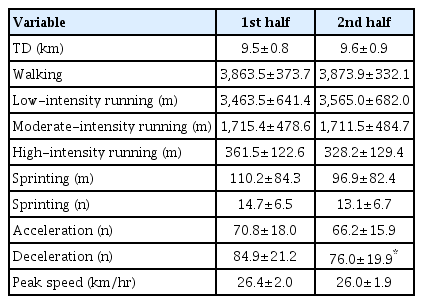
Match performance between first and second period of season
Match performance according to playing positions
Midfielders covered the most distance (ES=0.58) during a match compared to other positions (P<0.05), and the opposite was true for the CB position. WF covered the most distance of high-intensity running (ES=0.36) and sprinting (ES=0.57). The position with the highest number of accelerations (ES=0.31) was WF, and MF completed the highest number of decelerations (ES=0.47). Maximum speed (ES=0.60) during the match was higher among WF and FW than in other positions (P<0.05) (Table 3).
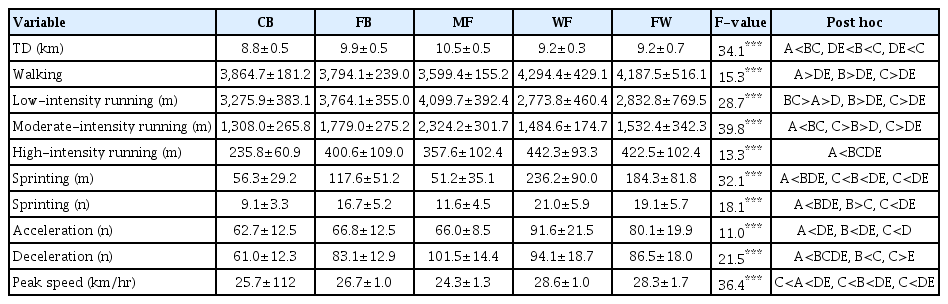
Match performance according to playing positions
Match performance between home and away matches
There were no significant differences between home and away matches in all variables (total distance, distance covered by exercise intensities, number of sprinters, accelerations and decelerations, and maximum speed) (ES rage of 0.01–0.22) (P>0.05) (Table 4).
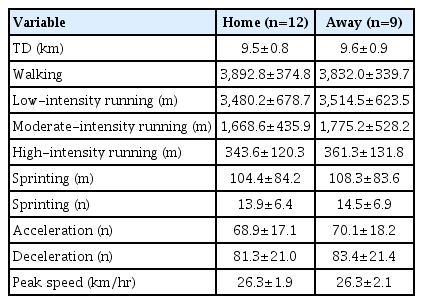
Match performance between home and away matches
DISCUSSION
This study was conducted to analyze the exercise activity of female professional soccer players during a season in South Korea. Female professional soccer players covered more than 9.5 km of distance and 400 m of high-intensity running per match. The position that covered the most distance of movement during the match was MF, and the movement distance for each exercise intensity differed, depending on the position. No significant differences were observed in all values between the first and second half-season, and between home and away matches.
Unlike the European women’s soccer league, which starts in September and ends in May of the following year, the Korean women’s professional soccer league starts in April and ends in November. The performance of players can deteriorate due to weather, as they have to play even during humid and hot summer. Therefore, body weight and BMI decreased during summer compared to those in preseason. However, there was no significant difference in the degree of exercise performance by intensity during the matches between the first and second half of the season. This result was opposed to a previous study that evaluated movement and total distance covered. High and very high-intensity running were different according to the season period (Rampinini et al., 2007). The reason for disagreement in these study results can be explained by the difference in season classification method. In consideration of the characteristics of the time period of the league operation, match activities were analyzed by dividing them into first and second half-season, but the season was classified into start, mid, and end of a competitive season in the previous study (Rampinini et al., 2007). As a result of the subdivision and analysis by month in the current study, even though statistical reliability was low due to the small number of participants, there were tendency of improvement in players’ performance, such as the total travelling distance in the last months of the season.
Unlike the factors that did not differ by periods of season, the number of decelerations was lower in the second half-season than in the first half-season. According to season classification, the decrease in the number of decelerations in the second half-season may be related to the summer weather. Since the second half-season starts in August, the number of decelerations, one of the forms for high-intensity exercise, can be affected by hot and humid weather. Therefore, as a result of analyzing the number of decelerations per month, it was lowest in August (73.1±19.8) compared to other months (77.7–93.4). Hot environment caused an imbalance in the amount of water and ion loss, which decreased physical and technical soccer performance by inhibiting muscle activities (Mohr et al., 2005; Rollo et al., 2021). According to a previous study that analyzed the physical performance of soccer players in different environmental conditions, exercise performance, especially the ability to perform high-intensity exercise, decreased in a high-temperature environment (No and Kwak, 2016).
Generally, higher rate of winning in soccer is observed during home matches due to home advantage (Pollard and Pollard, 2005). Players may cover more running distances and high-intensity exercise during home matches compared to away matches due to the familiar stadium environment and support from fans. However, in the current study, there was no difference in all measured variables, including the total distance during home and away matches. These results are closely related to the level of the team that participated in the study. The women’s professional soccer team participating in this study was a high-ranking team on the table, and they won most of their matches with a few draws or losses. Since the participating team usually dominated the matches with higher rate of ball possession compared to the opposing teams, in not only home matches but also in unfamiliar environment of away matches, match activities would not significantly differ between home and away matches in the current study. Research has shown that the amount of movement (>14.4 km/hr) in a winning situation during a match is less than in a draw situation (Buchheit et al., 2018).
Soccer players are required to have specific physical demands for each position due to the characteristics of the game style and tactics pursued by the team (Abbott et al., 2018). In the current study, the position that covered the most distance in a match was the MF, and the opposite was true for the CB position. These results were consistent with previous studies that analyzed the movement patterns of high-level soccer players during professional matches (Dellal et al., 2010). Although the capacity of explosive exercise performance is different with difference in body composition between male and female soccer players, movement patterns are similar during matches (Davis and Brewer, 1993; Thomas et al., 2002). Midfielders move the most distance during a game, which is closely related to the area of activity on the pitch of the MF position. The MF actively engaged in both offense and defense situations compared to other positions. CBs covered the shortest during a match, which is also related to their tactical movement pattern. The main role of the CB is to play and defend the opponent attacker rather than participate in the attack. Therefore, CBs require less activities in an attacking situation compared to other positions.
High-intensity exercise was performed the most among WFs, including sprint. This is not consistent with previous studies, as it has been reported that FW players completed the greatest distance during sprinting (Dellal et al., 2010; Dellal et al., 2011). These contrasting results can be due to difference in data collection target. Many players from various teams participating in the European men’s soccer league were targeted in the previous studies, but this study observed players exercise performance in a team during a season. Therefore, the exercise performance patterns of players by position in the current study may be different from other previous studies due to the tactical characteristics pursued by the team. For example, the team’s attacking tactics may have been configured in a form that players in the WF actively attack from both sides of the pitch. This explanation is supported by an observation that the maximum speed was also highest in the WF position.
The number of accelerations and decelerations, which indicate the degree of sudden changes in movement during the game were different, depending on the position. The number of acceleration and deceleration was highest among WF and MF, respectively. These results showed the characteristics of the exercise performance pattern of the positions. In other words, WF must have performed more acceleration because they are required to perform a lot of explosive movement to cover a wide space when there is a switched from defense to attack or vice versa. Additionally, the MF is considered to complete a higher number of decelerations because players must perform many changes in direction of movements in compacted situations with other players in a narrow space of the central area.
The important limitation of current study can be noted. Exercise performance during the season was analyzed for only one of several women’s professional soccer teams in the study. The movement patterns of players during a match are influenced by the tactical characteristics of the team. Therefore, there is a limit to generalizing the characteristics of a team’s athletic performance during the season as the characteristics of the entire women’s professional soccer league. In future study, it is necessary to analyze the exercise performance of players during the season with a large number of players from various teams to compensate for the limitation.
The results of this current study showed that female professional soccer players covered a lot of distance and performed high-intensity exercise as the male players, and there were differences in movement patterns for each position. Therefore, in order to improve the performance of female soccer players and prevent injuries, a training program should be constructed that considers the characteristics of each player and playing position rather than uniform training in a team.
ACKNOWLEDGMENTS
The authors received no financial support for this article.
Notes
CONFLICT OF INTEREST
No potential conflict of interest relevant to this article was reported.