Analysis of gait pattern between genders in Korean old people and the effect of dimensionless numbers
Article information

Abstract
The purpose of this study was to comparatively analyze normal gait on the plains by gender for old people reference data for the normal gait pattern for the old people. Participants were selected according to the Korean standard body type provided by the Ministry of Health and Welfare and used a three-dimensional motion analysis system. Cortex, Orthotrak, and Excel were used as the software for analyzing the extracted data, and IBM SPSS Statistics ver. 24.0 was used for statistical analysis. When data standardization was performed using the dimensionless numbers conversion, the step length and stride length of the lower extremities, which had differences between genders before dimensionless numbers conversion, showed no difference after dimensionless numbers conversion. Cadence, step time, and single support time of the left lower extremity, which had no difference between genders before dimensionless numbers conversion, were found to have significant differences after dimensionless numbers conversion. In addition, as a result of analyzing the coefficient of variation value to find out the degree of change in data due to dimensionless numbers conversion, there were increase and decrease in the coefficient of variation value ranging from −8.11% to 6.67% before and after dimensionless numbers conversion, which means dimensionless numbers conversion can affect the statistical test.
INTRODUCTION
The analysis of spatio-temporal variables in gait studies is important because it can evaluate the lower extremities disorder, gait stability, and gait pattern changes (Rose et al., 1991). In the major preceding studies on gait in old people, comparative analysis between age and gender (Callisaya et al., 2010; Doyo et al., 2011; Ko et al., 2011; Laufer, 2003; Menz et al., 2004), fall-related analysis (Kwon et al., 2018; Mortaza et al., 2014), research related to diagnosis and effectiveness for rehabilitation treatment (de Haart et al., 2005; Pau et al., 2016), and analysis of disease-related abnormal gait (Amaral-Felipe et al., 2020) have been conducted. Although these preceding studies have been analyzed for causality with factors that can influence spatio-temporal variables according to the purpose, they are insufficient to be used as reference data for evaluating normal and abnormal gait of the Korean old people. This is because the participants in foreign studies are completely different from Koreans in their physical characteristics. And in the case of domestic studies involving Koreans, conditions such as the age range of the study subjects, the suitability of physical characteristics, and the number of subjects to test for statistical significance were not met properly. Above all, the presented data was not standardized, so it is difficult to determine the factors of change in spatio-temporal variables.
For normal gait reference data, Hof (1996) proposed data standardization using dimensionless numbers (DN) method. DN is a mathematical model that removes physical characteristics such as weight and height that affect the body segment parameter used when calculating spatio-temporal and dynamics variables for gait pattern analysis. Hof (1996) proposals have been used in studies such as Pierrynowski and Galea (2001), Stansfield et al. (2003). In gait analysis, standardization data of normal gait is essential to find out whether the results of gait variable analysis are within the range of the normal gait and to compare the characteristics of abnormal gait with normal gait. However, no research has been conducted on the effects of standardized data targeting the gait variables of old people in domestic studies.
This study compares and analyzes spatio-temporal variables between genders by conducting a flat gait experiment with old people in Korean to prepare reference data for normal gait patterns of Korean old people. We intend to test the effect of Hof’s (1996) DN using gait data from old people.
MATERIALS AND METHODS
Participants
This study has selected 75 healthy old people without reported medical history related to walking and aged 70 years or older. To determine the actual targets of this study, this study has utilized purposive sampling to arrive at a total of 68 participants (male, 34; female, 34) in the ±1σ of standard height and weight as provided by Korea Health Statistics 2015: Korea National Health and Nutrition Examination Survey (KNHANES VI-3) from the Ministry of Health and Welfare (2016). The physical characteristics of the final participants are shown in Table 1. As a result of conducting a one-sample t-test on the KNHANES VI-3 to verify the representativeness of the subjects, it was verified that both male and female had the average body type of the age group (Table 1). Moreover, this study utilized Gpower, a sample size testing program, to determine the appropriate reference data, for Korean old people in their 70s. A two-sided test with parameters of α= 0.05, ES (effect size)=0.8, power=90% was conducted to compare with the standard data provided by KNHANES VI-3. This yielded a sample size of 34 participants, with 90.1% statistical power. In addition, 34 sample sizes were suitable as the sample size for this study because they maintain the normality of statistical data by central limit theorem and satisfy the minimum size for using the parametric analysis method.
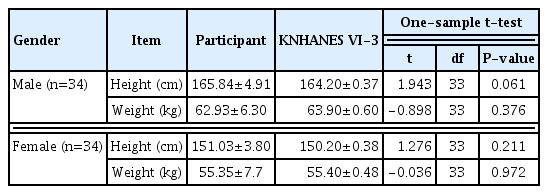
One sample t-test participants’ physical characteristics with Korea Health Statistics 2015; Korea National Health and Nutrition Examination Survey by Ministry of Health and Welfare of Korea (2016)
Equipment
The equipment used in this study is three-dimensional (3D) image analysis equipment and force platforms. The motion capture system of Motion Analysis (MotionAnalysis Corp., Santa Rosa, CA, USA) was used as the 3D image analysis equipment. The sampling frequency of the camera was 120 frames/sec, and the shutter speed was set to 1/1,000 sec. Also, the coordinate data extracted from the image was smoothed using a Butterworth two-order lowpass filter, and the cutoff frequency used in this process was 6 Hz. The force platforms used were type 9260AA6 (1 unit, 600×500) and type 9260AA3 (1 unit, 298.5×500) manufactured by Kistler (Kistler Instrument Corp., Novi, MI, USA); the sampling rate was set at 1,200 Hz and the gain value was ±5 V. The captured images were translated into 3D coordinate data through editing using Cortex, and spatio-temporal variable data were calculated using Orthotrak and Excel software.
Experimental procedure and content
Three days before the experiment, the participants were reminded to ensure that their everyday activity remained normal (refraining from drinking, excessive exercise, or lack of sleep), which was confirmed through interviews on the day of the experiment. Before the experiment, this study obtained measurements of the physical characteristics of the participants, including height, weight, lower extremity length, foot length, and foot width. The lower extremities length was determined to be the distance from the anterior superior iliac spine to the center of ankle joint. The anatomical locations of the markers attached to the participants for image analysis were determined using the Helen-Hayes marker set method. Participants practiced walking in their self-selected normal walking speeds for 3–5 min with having the markers attached. A section of six steps was filmed to extract data from the participants. This study identified the clips were the feet of the participants were properly placed on the force platform, and the participant and the researcher selected three gait data points where the participant was walking normally and calculated their averages for analysis.
The spatio-temporal variables were calculated on the original data obtained through the experiment and normalized using the DN of Hof (1996). Statistical analysis was performed using IBM SPSS Statistics ver. 24.0 (IBM Co., Armonk, NY, USA). Independent t-test was used to examine the difference between the lower extremities the same gender and between genders; the significance level for the statistical analysis was α=0.05.
RESULTS
Results of nondimensionless numbers’ data analysis on spatio-temporal variables
As a result of Shapiro-Wilk normality test for spatio-temporal variables before DN conversion, speed, single support time (SST), double support time (DST) of lower extremities were out of normality in male. Table 2 shows the results of the descriptive statistics for spatio-temporal variables, an independent t-test between genders, and a nonparametric test of Mann-Whitney U-test before DN conversion. According to Table 2, SST, DST, and step length of the right lower extremity were not assumed to be equality of variance. Differences between genders for spatio-temporal variables did not show statistically significant differences in cadence, step time, SST, and DST, but for speed, step length, and stride length, there was a significant difference in the mean value between genders, which was the same as the result in the Mann-Whitney U-test.
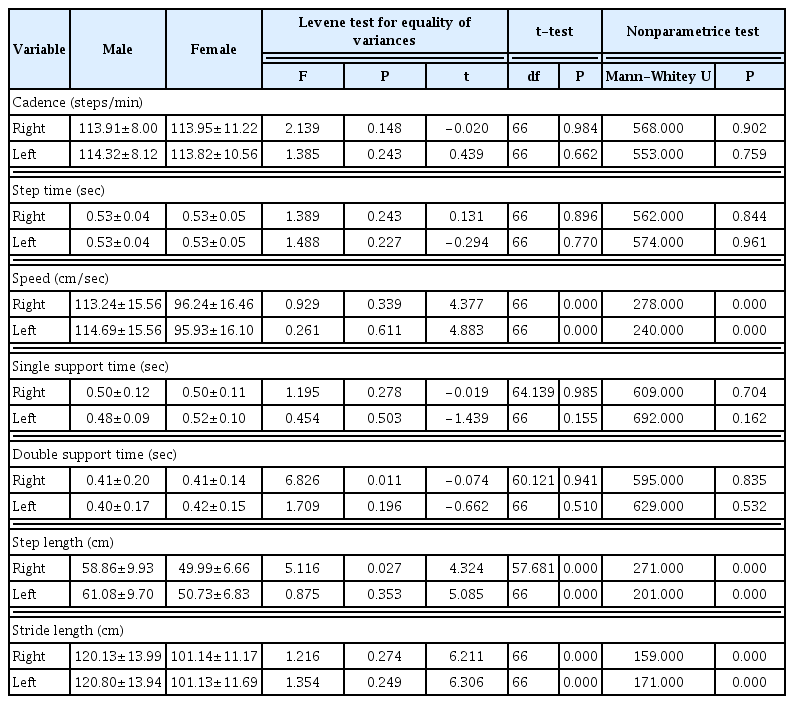
Descriptive statistics, equality of variance, and independent t-test for spatio-temporal variables before dimensionless numbers conversion
Fig. 1 is a graph showing the gait cycle of a participant. According to Fig. 1A, the average swing phase ratio was 36.10% for male and 35.85% for female. Fig. 1B shows the ratio of single support phase (SSP) and double support phase (DSP) in the stance phase. According to the results of this study, the ratio of DSP was 43.10% for males and 43.92% for females. In addition, the difference between SSP and DSP was 13.80% for male, which was greater than 12.12% for female (Fig. 1B).

Comparison of gait cycle ratios between participants by gender.
Results of dimensionless numbers’ data analysis on spatio-temporal variables
Table 3 shows the results of a descriptive statistics and an independent t-test as a test for spatio-temporal variables after DN conversion and the results of Mann-Whitney U-test as a test for nonparametric test. After the DN conversion, the speed was not out of normality, which had been out of normality before the DN conversion. In addition, all variables were assumed to be equality of variance. It can be seen that the data after DN conversion was smaller than that before DN, and the standard deviation value was also smaller. In the difference test between genders of spatio-temporal variables, there was no significant difference in step length and stride length of lower extremities after DN conversion. But, in the cadence, step time, and SST of the left lower extremity, there was a significant difference between genders. The results of the t-test and the Mann-Whitney U-test between genders were the same.
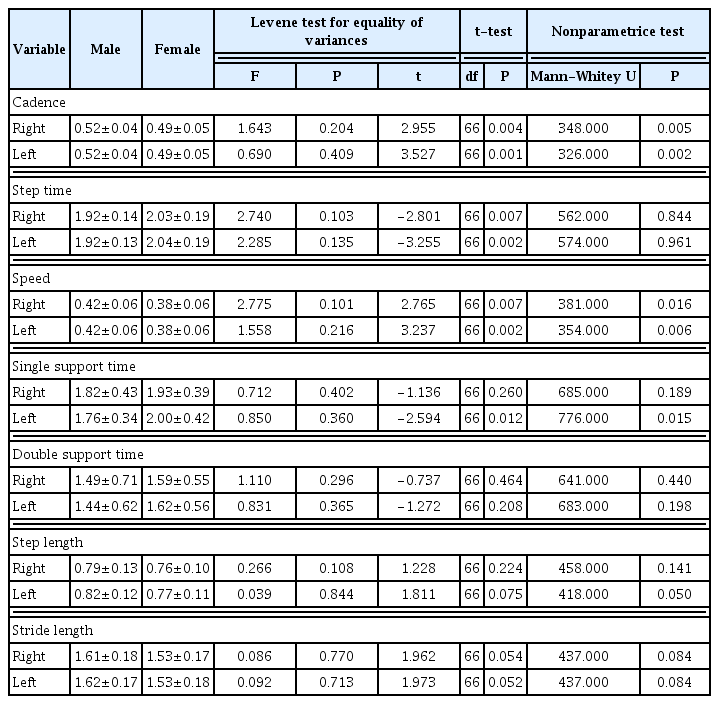
Descriptive statistics, equality of variance, and independent t-test for spatio-temporal variables after dimensionless numbers conversion
The coefficient of variation (CV) was calculated to find the change in the deviation before and after the DN conversion, and the results are shown in Table 4. According to Table 4, before and after the DN conversion, the CV value increased or decreased, and the range was −8.11% to 6.76%.

The results of coefficient of variation value and rate of change for spatio-temporal variables
DISCUSSION
In order to improve the validity of this study and to understand the gait patterns of Korean old people, we compared gait pattern with the results of preceding studies. Fig. 2 is a graph comparing the results of this study with the spatio-temporal variables of the preceding studies (Callisaya et al., 2010; Ko et al., 2011; Laufer, 2003). Although the objectives of the preceding studies presented were different, they were conducted for the old people, similar study methods were used. For comparison, spatio-temporal variables that were not converted by DN were presented among the result of the studies.
Comparison with preceding studies for spatio-temporal variables.
Compared with the results of preceding studies presented in Fig. 2, the results in this study show higher cadence due to shorter step length, shorter step time, and slower speed. In addition, in the speed and step length, the difference between genders in Korean participants was greater than that of the preceding study. In the total gait cycle, the stance phase ratio was similar to the results of Laufer (2003) and Ko et al. (2011) but numerically, Korean women had the lowest stance phase ratio. The DSP ratio, which is affected by gait speed, was found to be higher than that of the participants in Laufer (2003), whose gait speed was slow. Comprehensively, the characteristics of the walking pattern of the old people in Korea were short step length, slow gait speed, and high cadence, which are typical patterns to improve gait stability (Kressig et al., 2004). The variables compared with the preceding studies showed numerical differences. It is unclear whether they resulted from the differences in height, weight, and length of the lower extremity between Koreans and foreigners, or whether it is a characteristic of the gait pattern of Korean old people.
In the gender difference test, there were differences in statistical tests before and after the DN conversion. Among the spatio-temporal variables, there was a change in gender difference test before and after DN conversion at step length, stride length, cadence, and step time. This difference shows similar results to the study of Doyo et al. (2011) for the Japanese public. In addition, after the DN conversion, the normality of the variables was confirmed, which had been deviated from the normality before the DN conversion. And it was possible to assume an equality of variance in all variables. The change occurred in the CV value to investigate the change in the deviation due to the DN conversion. In other words, DN conversion is influencing the data of spatio-temporal variables to change statistical tests, and is thought to prove that the use of DN conversion is necessary in gait analysis.
Notes
CONFLICT OF INTEREST
No potential conflict of interest relevant to this article was reported.
ACKNOWLEDGMENTS
This work was supported by the Ministry of Education of the Republic of Korea and the National Research Foundation of Korea (NRF-2017S1A5B5A07064586).