Effects of 10-week combined training on lipid metabolic regulatory hormones and metabolic syndrome index according to exercise dose in obese male college students
Article information
Abstract
To analyze the effects of 10-week combined training (aerobic and resistance exercise) in three groups that were divided according to the total exercise dose per week and elucidate its effects on insulin and leptin (lipid metabolic regulatory hormones) and metabolic syndrome index. We included 24 obese male college students with body mass index ≥25 kg/m2. Each 8 subjects were randomly assigned according to the total exercise dose per week into the 150-, 270-, and 450-min/wk exercise groups, which performed 50-, 90-, and 90-min exercise per day for 3, 3, and 5 times a week, respectively. To maintain a constant level of exercise intensity, aerobic exercises were performed while maintaining 60%–70% of the maximal heart rate and resistance exercise at 60%–70% load of the initial 1 repetition maximum; 1 repetition maximum was measured every 2 weeks. Training effects on lipid metabolic regulatory hormones in the blood and metabolic syndrome index according to the total exercise dose/week were analyzed. Insulin and leptin levels decreased in the 270- and 450-min/wk exercise groups but no significant difference was observed in the 150-min/wk exercise group. Waist circumference showed a significant decrease in all groups, but blood pressure did not change. Fasting blood glucose levels significantly decreased in the 270- and 450-min/wk exercise groups. Triglyceride and high-density lipoprotein-cholesterol levels significantly decreased in the 450-min/wk exercise group. Combined training with an appropriate total exercise dose may prevent diseases caused by obesity by improving energy expenditure and insulin sensitivity and triggering positive changes in glucose and lipid metabolism.
INTRODUCTION
Globally, 2.2 out of 7.4 billion people are currently facing health problems related to overweight or obesity. Obesity is classified as a disease as well as a major risk factor for various health problems. It directly or indirectly affects the onset of hypertension, diabetes, hyperlipidemia, cardiovascular disorders, and a variety of metabolic diseases (Brawer et al., 2009). Metabolic syndrome is closely associated with obesity and insulin resistance, and regular exercise is known to reduce body fat percentage as well as the onset rate of metabolic diseases and cardiovascular diseases (Han et al., 2011). Combined training that incorporates both aerobic exercise and resistance exercise is recommended as an effective exercise method for improving metabolic syndrome (Ochner et al., 2007). Combined training reduces the blood level of lipids produced by the oxidation of fatty acids (Wooten et al., 2011), increases muscle mass, reduces the risk factors for cardiovascular diseases, and improves metabolic diseases (Sigal et al., 2006).
Additionally, there is no consensus on the proper amount of exercise that is beneficial for health. According to the revised exercise guideline by the Centers for Disease Control and Prevention and the American College of Sports Medicine (ACSM), daily physical activity at medium intensity for 30 min >5 times a week, or 150-min exercise per week, is recommended for all healthy adults from the ages of 18 to 65 years (Pate et al., 1995). Furthermore, the ACSM proposed an exercise dose with an energy expenditure of 1,000–3,500 kcal with an intensity 40%–70% of the maximum capacity for the purpose of improving blood lipid levels, and an exercise dose with an energy expenditure of 2,000–2,500 kcal per week or 300-min exercise per week for the purpose of obesity treatment (Egger, 2008). Recently, Gebel et al. (2015) reported that increasing exercise hours promotes health and showed that the risk of premature death further reduced in subjects who exercised daily for a little over an hour at moderate intensity compared to those who performed a recommended dose of exercise at mild intensity.
Exercise reduces abdominal fat which in turn inhibits the entrance of free fatty acids into insulin-sensitive tissues and lowers blood pressure by reducing triglyceride (TG) levels and increasing high-density lipoprotein-cholesterol (HDL-C) levels (Katzmarzyk et al., 2003). Leptin, which directly affects insulin secretion, insulin resistance, and regulates/controls energy intake and consumption, is also reduced by long-term exercise (Essig et al., 2000).
Exercises for prevention and improvement of patients who are overweight, obese, and have metabolic syndrome are focused on the total amount of energy expended. Although, the guidelines by ACSM continue to be followed and the controversy regarding the proper exercise dose is ongoing, only a few studies have examined the effects of differences in exercise dose according to the hours of combined training on the regulation of lipid metabolism and risk factors for metabolic syndrome. Therefore, this study aimed to analyze the effects of 10-week combined training incorporating regular aerobic and resistance exercise on lipid metabolic regulatory hormones and metabolic syndrome index according to the total exercise dose per week in obese male college students.
MATERIALS AND METHODS
This study included 24 obese male college students at the Kunsan National University with body mass index ≥25 kg/m2 who did not exercise regularly. Eight subjects were randomly assigned to 1 of the 150-, 270-, and 450-min exercise (Ex) groups, according to the total hours of exercise performed over a week. This study was approved by the Institutional Review Board of Kunsan University (1040117-201809-HR-026-01), and the physical characteristics of the subjects are shown in Table 1.
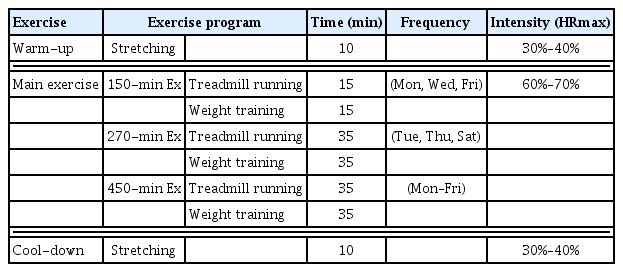
The combined training program which incorporates aerobic and resistance exercise is shown in Table 2. Over 10 weeks, the 150-, 270-, and 450-min Ex groups performed the exercises for 50, 90, and 90 min daily for 3, 3, and 5 times a week, respectively. To maintain the exercise intensity at a constant level, the subjects ran on a treadmill at 60%–65% of maximal heart rate (HRmax) for the first 4 weeks and 65%–70% of HRmax from week 5 to 10. For resistance exercise, bench press, leg press, leg curl, sit-up, shoulder press, side lateral raise, lat pull down, leg extension, arm curl, calf raise, and squat exercises were performed. The exercise intensity was set at 60%–70% of the one-repetition maximum (1RM) which is the maximum weight each individual could lift once, and 10–12 repetitions were performed for 2–5 sets. Additionally, the 1RM was measured every 2 weeks to increase the load.
The subjects’ blood samples were collected before and after the 10-week program under the same conditions and time periods. The subjects arrived at the G clinic on the day of blood draw, took plenty of rest, and a medical laboratory technologist withdrew blood from the veins of the forearm. The collected blood was centrifuged at 3,000 rpm for 30 min and stored in a freezer at 70°C. Analysis of all the variables was done by the G corp.
Metabolic syndrome in this study was defined according to the standards suggested by the National Cholesterol Education Program-Adult Treatment Panel III (NCEP-ATP III) in 2001 (Expert Panel on Detection, Evaluation, and Treatment of High Blood Cholesterol in Adults, 2001) and was categorized into 5 metabolic syndrome indicators including fasting blood glucose, TG, HDL-C, blood pressure, and waist circumference (WC).
All data analyses in this study were conducted using the IBM SPSS Statistics ver. 22.0 (IBM Co., Armonk, NY, USA). Means and standard errors for all measurements were calculated, and repeated measures analysis of variance was performed to determine the significance of the lipid metabolic regulatory hormone and the metabolic syndrome index according to the total exercise time per week. The significance level was set at 0.05.
RESULTS
Changes in the insulin level
An interaction between the group and the time period was observed (P<0.05). The 150-min Ex group did not show a significant change in the insulin level from 4.93±3.39-μU/mL pre-exercise to 5.16±3.26-μU/mL postexercise. In contrast, the 270- and 450-min Ex groups showed a significant decrease in the insulin level from 8.06±3.97-μU/mL pre-exercise to 5.90±1.11-μU/mL postexercise (P<0.05) and from 7.79±2.82-μU/mL pre-exercise to 6.92±3.56-μU/mL postexercise (P<0.05), respectively (Table 3).
Changes in the leptin level
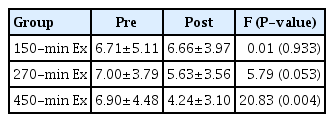
An interaction between the group and the time period was observed (P<0.05). The 150-min Ex group did not show a significant change in the leptin level from 6.71±5.11-ng/mL pre-exercise to 6.66±3.97-ng/mL postexercise. In contrast, the 270-min Ex group showed a decreasing trend in the leptin level from 7.00± 3.79-ng/mL pre-exercise to 5.63±3.56-ng/mL postexercise. The 450-min Ex group showed a significant decrease from 6.90± 4.48-ng/mL pre-exercise to 4.24±3.10-ng/mL postexercise (P< 0.01) (Table 4).
Changes in the WC
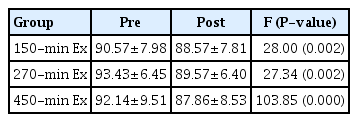
An interaction between the group and the time period was observed (P<0.05). The 150-, 270-, and 450-min Ex groups showed a significant decrease in the WC from 90.57±7.98-cm pre-exercise to 88.57±7.81-cm postexercise (P<0.01), from 93.43±6.45-cm pre-exercise to 89.57±6.40-cm postexercise (P<0.01), and from 92.14±9.51-cm pre-exercise to 87.86±8.53-cm postexercise (P<0.001), respectively (Table 5).
Changes in the systolic and diastolic blood pressure
There was no interaction between the group and the time period for systolic blood pressure, diastolic blood pressure. The results of the main effect demonstrated no significant difference among groups and between time periods (Tables 6, 7).
Changes in the fasting blood glucose level
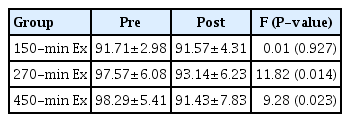
An interaction between the group and the time period was observed (P<0.05). The 150-min Ex group did not show a significant change in the fasting blood glucose level from 91.71±2.98-mg/dL pre-exercise to 91.57±4.31-mg/dL postexercise. In contrast, the 270-min and 450-min Ex groups showed a significant decrease in the fasting blood glucose level from 97.57±6.08-mg/dL pre-exercise to 93.14±6.23-mg/dL postexercise (P<0.05) and from 98.29±5.41-mg/dL pre-exercise to 91.43±7.83-mg/dL postexercise (P<0.05), respectively (Table 8).
Changes in the TG level
Although the interaction between the group and the time period was slightly higher than the significance level, it was determined to be present. Therefore, a paired sample t-test was performed in each group. The 150-min and 270-min Ex groups did not show a significant decrease in the TG level from 164.00±22.59-mg/dL pre-exercise to 160.43±22.51-mg/dL postexercise and from 170.00±23.14-mg/dL pre-exercise to 159.71±30.43-mg/dL postexercise, respectively. In contrast, the 450-min Ex group showed a significant decrease in the TG level from 167.57±39.78-mg/dL pre- exercise to 146.14±40.16-mg/dL postexercise (P<0.01) (Table 9).
Changes in the HDL-C level
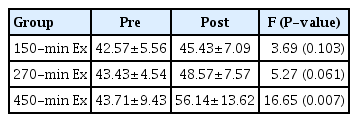
An interaction between the group and the time period was observed (P<0.05). The 150-min Ex group did not show a significant change in the HDL-C level from 42.57±5.56-mg/dL pre-exercise to 45.43±7.09-mg/dL postexercise. In contrast, the 270-min Ex group showed an increasing trend in the HDL-C level from 43.43±4.54-mg/dL pre-exercise to 48.57±7.57-mg/dL postexercise. The 450-min Ex group showed a significant increase from 43.71±9.43-mg/dL pre-exercise to 56.14±13.62-mg/dL postexercise (P<0.01) (Table 10).
DISCUSSION
Regular physical activity directly reduces the synthesis and secretion of leptin (Hickey et al., 1997) and lowers the concentration of insulin in obese people (Kelley and Goodpaster, 1999). Aerobic exercise, as well as resistance exercise, has been reported to significantly reduce insulin concentration and increase insulin sensitivity (Kirwan et al., 1993; Miller et al., 1994). Cuff et al. (2003) reported that female postmenopausal type 2 diabetics with abdominal obesity in a combined training group showed a significant increase in insulin sensitivity as compared to the aerobic exercise group. This suggests that aerobic exercise alone is not enough for improving metabolism by changes such as insulin sensitivity and basal metabolism by increasing lean body mass and muscle mass (Hamdy et al., 1994). Resistance training plays a crucial role in increasing insulin sensitivity by activating glucose intake in skeletal muscles (Sanz et al., 2010).
In this study, insulin significantly decreased in the 270 min and 450 min groups that performed weekly combined training. Leptin showed a significant decrease in the 450-min Ex group and a tendency of decrease in the 270-min Ex group albeit without statistical significance. However, there were no changes in insulin and leptin levels in the group that performed weekly 150 min of combined training for 10 weeks, suggesting that this exercise dose was not sufficient to reduce insulin and leptin levels by improving insulin resistance. Considine et al. (1996) reported that 5.8 ng/mL of leptin is secreted in normal people and is decreased by 10% after jogging regularly for 3 hr per week. Similar to previous studies which showed that insulin and leptin hormones levels, which are associated with obesity, can be improved by various types of exercises including aerobic or resistance exercise (Hickey et al., 1997; Kelley and Goodpaster, 1999). Our study also suggests that energy expenditure from the combined training with the proper exercise dose and an increase of body energy expenditure from the increased metabolic rate during rest after exercise changes insulin and leptin levels.
Abdominal obesity, which promotes high TG level, low HDL-C level, and the onset of hypertension by increasing the level of free fatty acids in adipose tissues, is a major risk factor for metabolic syndrome (Shulman, 2000). Previous studies which examined the changes in metabolic syndrome factors according to exercise dose have reported that the risk of metabolic syndrome is reduced in groups with high exercise dose (Ekelund et al., 2005; Laaksonen et al., 2002). WC is highly associated with body weight and it is known that regular exercise generally lowers body weight, abdominal fat percentage, and WC. A study by Seo et al. (2011) showed that after a 12-week combined training for 240 min and 150 min per week, obese middle-aged women had a significant decrease in their WC.
In this study, WC significantly decreased in all groups regardless of the total exercise dose per week, and a higher dose of the exercise was shown to be more effective for reducing WC. According to Ross and Janssen (2001) who reported the effects of physical activities on visceral fat loss, the amount of total body fat lost by physical activities is dependent on the exercise dose, and exercise is associated with the loss of visceral fat tissues regardless of weight loss. Our study showed that the 10-week combined training was effective for improving abdominal obesity, which is strongly associated with the rate of chronic diseases, in all the exercise groups.
Additionally, physical activity is known to reduce the risk factors for hypertension and improve systolic and diastolic blood pressure (Miyachi et al., 2003). However, in our study, systolic and diastolic blood pressure did not show significant changes after the combined training in any exercise group. Regarding the changes in blood pressure by exercise, Stevenson and Topp (1990) reported no significant changes in blood pressure after implementing low and medium intensity exercises in the elderly for 9 months, and Kang et al. (2002) claimed that high-intensity exercise for ≥6 months is required to reduce diastolic blood pressure in obese adolescents. The fact that age, exercise duration, and type of exercise can affect study results, and that the blood pressure of most of the participants in our study was in the normal range may have been the reason why changes of blood pressure were not observed.
Most of the glucose in the blood is used for glycogen synthesis in the liver and muscles as a result of exercise, and the utilization rate of glucose in the muscles also increases. Therefore, exercise enhances insulin sensitivity and prevents the progression to metabolic disorder (Shahid and Schneider, 2000).
Although the fasting blood glucose levels of the exercise participants in this study were all within the normal range, they were significantly decreased in the 270 and 450 min/wk combined training groups. These results were most likely due to the increase of fat-free tissues and consequent increase in the oxidation capacity of blood fatty acids after aerobic and resistance exercise for ≥270 min per week (Boden, 2011). The reduction of visceral fat and enhancement of insulin sensitivity caused by body fat loss which improved glucose absorption in the peripheral tissues and the inhibition capacity of liver glucose production (Sarafidis and Bakris, 2006).
Finally, regarding the effects of exercise on blood lipid from previous studies, Park et al. (2011) reported no changes in TG and HDL-C levels after implementing a combined training for 180 min per week for 12 weeks in obese female high school students. Ha and So (2012) also did not see an improvement in TG and HDL-C levels after implementing a combined training for 240 min per week for 12 weeks in obese college students. However, a study by Park (2001) showed an increase in HDL-C level in obese middle- aged women after implementing a combined training for 360 min per week for 24 weeks and suggested increasing the duration of exercise or exercise intensity in order to induce changes in HDL-C level. In this study, TG and HDL-C levels significantly increased only in the 450-min/wk Ex group and the HDL-C level showed a tendency to increase in the 270-min/wk Ex group.
These results show that participating in 10-week combined training with the exercise doses of 270 and 450 min/wk prevents diseases due to obesity by improving energy expenditure and insulin sensitivity and triggering positive changes in glucose and lipid metabolism in obese male college students, compared to the exercise dose of 150 min/wk.
In conclusion, additional studies on exercise programs with different exercise doses to analyze the effects of exercise more accurately from the preventive and therapeutic approach for obesity and metabolic syndrome will be able to propose the most effective exercise dose.
Notes
CONFLICT OF INTEREST
No potential conflict of interest relevant to this article was reported.


