The effects of daily food ingestion on improved immune functions and health promotion of bodybuilding athletes
Article information

Abstract
The purpose of this study was to investigate the effects of different weight reduction methods on the body composition characteristics, cardiopulmonary functions, and health promotion of elite bodybuilding athletes in a comprehensive manner. For this purpose, the study analyzed the effects of two different weight reduction methods on 25 elite bodybuilding athletes registered at the Bodybuilding Association over a period of 6 weeks. There were interactive effects on macronutrients, macrominerals, and antioxidants according to weight reduction methods as the experiment group (6%±2%) maintained a certain amount of food intakes across various nutrients including energy intakes or made a slow decrease it, whereas the traditional group (16%±4%) made a sharp decrease in it due to relatively greater weight reduction than the experiment group and thus showed pattern differences from it. As for immunity variables, there was an increase to certain cytokines despite the traditional high weight reduction method, but it caused no excessive reduction of immunity or rapid decrease to certain factors of body composition. In addition, there were no significant differences in main and interactive effects on the one-repetition maximum of bench press and squat, which are two functional indicators of health promotion. These findings imply that the low weight reduction method within the range of 6%±2% minimized or maintained changes to muscle circumference or mass while causing no improvement to muscular strength.
INTRODUCTION
In the field of bodybuilding, ranks are determined based on the examination of muscular shapes and sizes, degree of balanced development, symmetry, color of the skin, muscular definition and separation, and frames and postures. In the past, the normal development of bodybuilding was disturbed by common sayings that weight training, whose goal was to reinforce the performance of bodybuilding athletes, had less influence on the development of the heart than the prominent development of the physique including muscles and would weaken the functions of the heart relatively and that the excessive development of muscles would reduce their speed and thus have negative impacts on their agility or cause the loss of flexibility or coordination. A series of scientific researches on bodybuilding that began in 1950, however, demonstrated that the right weight training would improve health and enhance various fitness factors rather than exerting the negative effects mentioned earlier.
As for the performance characteristics of bodybuilding, its goal is to develop muscular hypertrophy (size) and definition as much as possible based on a balanced body shape (Lambert et al., 2004). For this, bodybuilders consume more energy than the usual level during off-seasons to increase their muscle mass to the maximum and reduce their body fat to the lowest limit and attempt at excessive weight loss before a competition to increase their muscular separation and definition while maintaining their muscle mass as much as possible.
Weight reduction over a short period of time is attributed to the loss of body water essential to the body composition in most cases. It was reported to change the duration of exercise, reaction time, plasma and blood volume, and electrolyte concentration in the body and have overall negative effects on physiological abilities. Hursh (1972) reported that fasting, reduction of caloric intakes, and dehydration caused a decrease to muscular strength, task performance, plasma and blood volume, heart function, and oxygen consumption and affected the temperature regulation process. They were also reported to reduce the blood volume to the kidney and the storage of glycogen in the liver and facilitate the reduction of electrolytes.
A majority of bodybuilders reduce their weight based on a vague idea that the increase of muscle size through weight gain during off-seasons will lead to the improvement of performance at a bodybuilding competition. They, for instance, increase 15% or more of their usual weight during off-seasons by spending a lot of money on the consumption of food with excessive calories, nutrients and supplements. During a season, they need to attempt at excessive weight loss to reduce their weight has been increased too much and require more effort, training, and patience to reduce weight. This is a vicious cycle.
In recent years, however, some bodybuilding athletes at the top level prefer a new approach called low weight reduction, which makes it easier to lose weight during a season. That is, they maintain their usual weight within 5% through caloric restriction during off-seasons unlike the traditional weight reduction method. This new method makes it easy to reduce weight during a season and can save money spent on food and supplements for excessive weight gain, thus being very encouraging. There are, however, no studies to compare and analyze the traditional (about 15%) and new (about 5%–6%) weight reduction methods in physiological influences and immune functions. There is a need to test the methods scientifically.
Bodybuilding mainly involves resistance training of high intensity, which means that lack of enough nutrient supply both in quantity and quality will make it impossible to grow muscles effectively and cause a delay in muscular growth. In addition, it will slow down the rate of recovery from fatigue after exercise and lower the immune functions, thus increasing an injury risk. Bodybuilders should consume three major nutrients, protein, carbohydrate, and fat evenly and choose a method of maximizing efficiency and effect through scientific food ingestion rather than consuming large amounts of food thoughtlessly to increase the muscle size. They also need to consume six major nutrients, which include carbohydrate, fat, protein, vitamin, mineral, and water, evenly to prevent their deficiency and maintain or improve their exercise performance.
This study thus set out to investigate the effects of differences in daily food ingestion according to different weight reduction methods on the immune and health promotion functions of elite bodybuilders by analyzing various markers (hormone, cytokine, immunoglobulin, and leukocyte count) related to the immune functions and muscular strength indexes according to two different weight reduction methods (traditional one=high weight reduction vs. new one=low weight reduction) over 6 weeks (2 weeks for muscular separation and 4 weeks for muscular definition) of weight reduction.
MATERIALS AND METHODS
Subjects
The subjects include 25 incumbent elite male bodybuilding athletes that belonged to the Bodybuilding Association, had a career of winning awards at a national competition, and wanted to participate in the study voluntarily. Table 1 shows their physical characteristics.

Physical characteristics of the subjects (n=25; EX [n=13], TRAD [n=12])
Research design
The subject bodybuilders listened to explanations about the content and procedures of the study, gave consent to voluntary participation in an experiment, and met the following conditions. They were divided into the experiment group (6%±2% of the competition weight) of 13 and the traditional group (16%±4% of the competition weight) of 12. One of the traditional group members dropped out due to failed dieting. In the end, the experiment ended up with 13 and 12 bodybuilders in the experiment and traditional group, respectively. The criteria of selecting subjects were as follows:
Winning a third place or higher at a national competition for the last three years.
Preparing for a national competition as athletes of the Bodybuilding Association in 2012.
Doing weight training regularly for the last 6 months.
Enjoying no excessive drinking (drinking a bottle of Soju a day for four days or more per week) usually.
Male bodybuilders in the age range of 18–39.
Experiment procedures and measurement methods
Measurement of variables of body composition characteristics
The variables of subjects’ body composition characteristics were measured with a body composition analyzer (Inbody 720, Biospace, Seoul, Korea) at 9:00 a.m. before exercise every Saturday before the experiment and for 6 weeks. The indoor humidity was kept at 55%–65% during measurement. Mean values were obtained with three measurements in weight, muscle mass, fat mass, body mass index (BMI), and basic metabolic rate for analysis.
Daily food ingestion
For daily food ingestion data, the subjects were asked to record their food intakes over 6 weeks based on models and eye measurements, entering the information about the name of food, the name of materials along with their weight, and amount of consumption at Meals 1, 2, 3, and 4 every day. The nutrients they consumed were analyzed with CAN-Pro 3.0 for Professionals (Korean Nutrition Society) based on the data of Tuesday, Thursday, and Saturday per week. Furthermore, the intakes (g) of each group for the entire intakes (g) were analyzed to evaluate the quality of each meal based on the consumption of food groups.
Blood analysis
For blood analysis, the subjects took a rest for 30 min after arriving at the experimentation room on the day of measurement. About 20 mL of venous blood was collected from the antecubital vein with a disposable vacuum syringe at 8:00–9:00 a.m. The whole blood in the ethylenediamine tetraacetic acid tube was analyzed for white blood cell (WBC) and complete blood cell counts within 12 hr. The blood in the tube underwent centrifugation in a centrifuge at 3,000 rpm for about 10 min. The serum was kept at −80°C until analysis and used to analyze immunoglobulins (IgA, IgG, and IgM) and cytokine (tumor necrosis factor-α [TNF-α], interleukin [IL]-1β, IL-6).
Measurement of maximum muscular strength
Maximum muscular strength (one-repetition maximum, 1RM) was measured in the indirect measurement method based on the Lombardi coefficient.
Weight reduction programs
In the study, the exercise experiment involved resistance training (free weight) and aerobic exercise on the treadmill. The subjects did the same training, taking into consideration their respective weight division and fitness levels. A 6-week weight training exercise program consisted of muscular separation parts for two weeks and muscular definition parts for four weeks. During the period of muscular separation, they did 35 events of weight training and aerobic training. During the period of muscular definition, they did 38 events of weight training and aerobic training. A 6-week aerobic exercise program took into account weight and conditions so that the subjects would consume 300–500 kcal in a session of exercise.
Table 2 shows The aerobic training program for muscular separation and definition conditions.

The aerobic training program for muscular separation and definition conditions
Data treatment
Collected data was treated with the SPSS ver. 12.0 (SPSS Inc., Chicago, IL, USA) statistical program to obtain mean and standard deviation for all the variables. Differences in the blood variables between the two groups (low vs. high weight reduction) were tested with two-way repeated measure analysis of variance by the period (before, after, and during the 6-week program).
Bonferroni was performed for post hoc testing. The level of statistical significance (α) was set at 0.05 in the study.
RESULTS
Weight changes according to the weight reduction methods for 6 weeks
Weight reduction rate (%) of the groups according to different weight reduction methods (experiment group=low weight reduction vs. traditional group=high weight reduction) for six weeks was observed. The traditional weight reduction method would usually attempt at about 15% of weight reduction on average, but the present study recorded a reduction rate of 16%±4% in the traditional group. The experiment group that attempted at the new low weight reduction method recorded a reduction rate of about 6.5%±2% on average.
Body composition changes according to the weight reduction methods for 6 weeks
Table 3 shows the repeated analysis of variance of body composition variables according to the group and period.
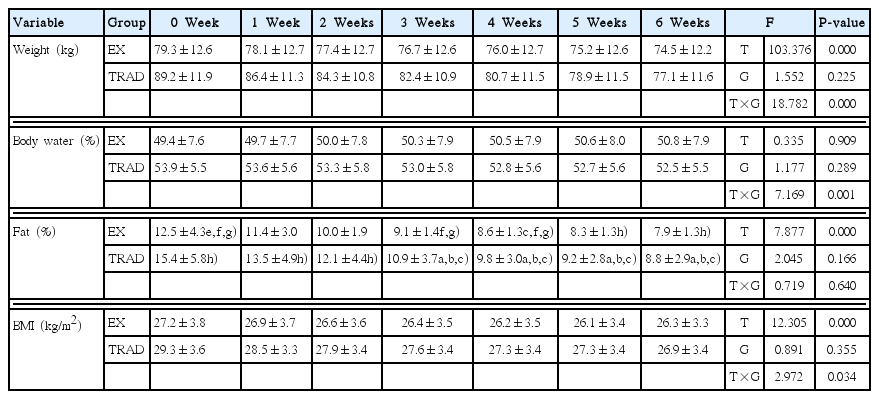
Body measurement changes and analysis results of the groups for 6 weeks (two-way mixed analysis of variance results)
As seen in Table 3, there were interactive effects in weight (P=0.000), BMI (P=0.000), and body water (P=0.000). Significant differences were found in body fat percentage (%) only according to the period. That is, there were interactive effects on weight, body water, and BMI according to the degree of weight reduction due to their pattern differences with the exception of body fat percentage.
Changes to the food ingestion variables of the groups according to the weight reduction methods over 6 weeks
As seen in Table 4, there were significant interactive effects on all the macronutrient variables including energy (P=0.000), protein (P=0.000), carbohydrate (P=0.000), lipid (P=0.000), and dietary fiber (P=0.000) except for water (P=0.174). There were also interactive effects on all the macromineral variables including calcium (P=0.000), phosphorus (P=0.000), sodium (P=0.000), and potassium (P=0.000). Significant interactive effects were also observed in all the antioxidant variables including vitamin E (P= 0.000), selenium (P=0.000), and beta-carotene (P=0.000) except for vitamin C (significant differences only according to time, P= 0.000).

Food ingestion changes and analysis results over 6 weeks (two-way mixed analysis of variance results)
Changes to the immunity variables before and after the experiment according to the weight reduction methods
Table 5 shows the results of repeated analysis of variance for immunity variables (testosterone [T], cortisol [C], T/C ratio, IgA, IgG, IgM, TNF-α, IL-6, IL-1β, WBC, red blood cell, neutrophils, lymphocytes, monocytes, eosinophils, basophils, hemoglobin, reticulocytes, platelets, Hct, and C-reactive protein [CRP]) according to the group and period. As seen in Table 5, there were differences only in T and C according to time among the hormone variables including T, C, and T/C ratio. The analysis results after the experiment show only the experiment group made a significant increase in T (P=0.036) and C (P=0.016) after the experiment. Although there were no statistically significant differences in the T/C ratio, the experiment and traditional groups showed an increasing and decreasing tendency, respectively, after the experiment.

Blood variable changes and analysis results of the groups before and after the experiment
The study observed some immunoglobulins including IgA, IgG, and IgM and found a significant reduction only in IgG after the experiment. The analysis results after the experiment show that IgG decreased only in the traditional group (P=0.043).
The study also observed cytokine variables including TNF-α, IL-6, and IL-1β and found significant differences in TNF-α according to the group (P=0.033) and period (P=0.003). IL-1β made a significant increase (P=0.000) in both the groups after the experiment.
Of these subunits including WBC, only monocytes made a significant increase (P=0.005) after the experiment. The analysis results after the experiment show that this increase was only observed in the experiment group.
There were no significant differences in CRP according to the period, group and interactive effects.
Changes to muscular strength before and after the experiment according to the weight reduction methods
Table 6 shows the repeated analysis results of variance for muscular strength (bench press and squat) according to the group and period. As seen in Table 6, there were no significant differences in the main and interactive effects of bench press and squat 1RM.

Muscular strength changes and analysis results of the groups before and after the experiment (two-way mixed analysis of variance results)
DISCUSSION
Changes to the variables of body composition characteristics according to the weight reduction methods (traditional vs. experimental) for 6 weeks
The findings show that the traditional group made a greater reduction in weight and BMI for 6 weeks than the experiment group. There were opposite patterns of water body changes between the groups. While the experiment group made a slow increase in it over 6 weeks, the traditional group made a slow decrease in it. Since bodybuilding is a weight division sport, bodybuilders need to lose weight before a competition. It is very often that they make an attempt at rapid weight reduction of 10 kg or more. Here, the right approach is to keep the lean body mass and reduce body fat. The findings of the present study show that the experiment group (weight reduction of 6%±2%) made an increase in body water after weight reduction unlike the traditional group.
This is a major finding of the study since increasing body water despite 6 weeks of weight reduction means the control of water loss and the increase or maintenance of lean body mass over the same period, given that about 70% of lean body mass is water. Huygens et al. (2002) reported that bodybuilders were muscular and had low body fat percentage of 6.8%–7.3% and high lean body mass. High-intensity muscular and aerobic training done during the period of weight reduction in the present study helped the bodybuilding athletes of the experiment group preserve their lean body mass and increase their body water instead of losing it. These findings mean that there is a loss or increase of body water according to the degree of weight reduction. Extreme dietary limitations caused the traditional group to lose body water despite the same amount of training (muscular and aerobic) as the experiment group. The body fat percentage (%fat) made a significant decrease both in the experiment and traditional group after the experiment unlike weight, body water and BMI. It was because weight, body water and BMI (depending on weight changes since the height was constant) were single variables unlike the body fat percentage (%). That is, the body fat percentage is determined by the percentage of fat mass in the weight of a person and thus subjected to relatively less change and influence over time than the single variable of weight, body water, and BMI. The reduction of body fat percentage according to weight reduction is in line with the findings of Withers et al. (1997), which reported that the body fat percentage of elite male bodybuilding athletes dropped from 9.1% to 5.0% after weight reduction over 10 weeks before a competition. In the present study, both the experiment and traditional group dropped in body fat mass after 6 weeks of weight reduction: the former dropped from 12.5%±4.3% to 7.9%±1.3%, and the latter from 15.4%±5.8% to 8.8%±2.9%. These findings match those of previous studies.
These findings indicate that the new weight reduction method of smaller weight reduction is more effective for the increase or preservation of muscular mass than the traditional weight reduction method of 16%±4% weight reduction.
Changes to food ingestion according to the weight reduction methods (traditional vs. experimental)
The study examined the interactive effects of the weight reduction methods on the intakes of macronutrients, macrominerals, and antioxidants and found that the experiment group (6%±2%) maintained a certain level of intakes across various nutrients including energy or made a slow decrease to them, whereas the traditional group (16%±4%) made a sharp decrease to the intakes of various nutrients including energy due to their attempt at relatively greater weight reduction than the experiment group. These pattern differences led to interactive effects between them.
The experiment and traditional group recorded average daily intakes of 3,131±575 kcal and 3,502±445 kcal, respectively, at the baseline and 2,766±508 kcal and 2,605±331 kcal, respectively, at week 6, reducing by 12%–16% or so. Kleiner et al. (1994) reported that male bodybuilding athletes consumed energy of 3,500–4,800 kcal a day during training and that approximately 55% of them began to limit their meals one to three months before a competition and decreased to 2,015–2,620 kcal, which was 26%–60% of their daily energy intakes during training. Sandoval and Heyward (1991) reported that the food diversity of bodybuilding athletes dropped during weight reduction from training. Hickson et al. (1990) reported that the types of food consumed by male bodybuilding athletes decreased by 30% or more during weight reduction. It was reported that overseas professional bodybuilding athletes maintained a low energy diet of 2,015 kcal right before a competition (Kleiner et al., 1990). The present study also reported the same pattern of energy intake reduction as previous studies, but the scope was not as big as them. This difference in food ingestion was attributed to amount of training that made a rapid increase during the period of muscular definition.
There were interactive effects on the average daily intakes (g/kg/day) of protein, carbohydrate, fat and dietary fiber just like various nutrients including energy. Their cause can be interpreted in the same context as them. It is, however, noteworthy that they had huge differences from their general recommended intake percentage (%). The elite bodybuilders in the present study, for instance, had a very low intake percentage of carbohydrate (experiment group: 40.9%, traditional group: 46.3%) and fat (experiment group: 4%, traditional group: 6.8%) and a very high intake percentage of protein (experiment group: 33.6%, traditional group: 37.9%). There is a reason for concern since bodybuilding athletes may have excessive amounts of protein due to the addition of amino acid supplements.
The protein requirement of bodybuilding athletes is 2.0 g per 1 kg of weight. The bodybuilders in the present study consumed protein about 1.5–2 times the recommended intakes. It was because they wrongfully believed that an increase to protein intakes would results in bigger muscle sizes and had no enough systematic knowledge about protein intakes.
The study also examined the intakes of protein, phosphorus, and potassium among the bodybuilding athletes and found that the experiment group consumed them 3.8, 4.3, and 2.1 times more than the recommended amounts and that the traditional group consumed them 4.7, 4.7, and 2 times more than the recommended amounts. As for calcium, the experiment and traditional group recorded a lower intake than the recommended amount by 52% and 86%, respectively. These findings are due to the decreased diversity of food and a reduction of 30% or more in the types of food among bodybuilding athletes during the period of weight reduction than off-seasons like the findings of Sandoval and Heyward (1991) and Hickson et al. (1990) above. The subjects of the present study showed a tendency of choosing a couple of foods repeatedly for low fat diet. Their main choices were sweet potato, chicken breast, vegetables (the cucumber and onion) and fruits (the apple). They would have them 4 times a day or more or limit the types of food they had. As the present study reported, they would focus heavily on certain nutrients, thus making a huge increase to some nutrients and a decrease to others. Excessive increase and decrease of certain nutrients can cause the problem of nutritional imbalance and have negative effects on the health of athletes, thus requiring special attention and careful management. Excessive intakes of protein cause a loss of calcium, which raises a need for additional calcium intakes for bone health.
Changes to the immunity function variables according to the weight reduction methods (traditional vs. experimental) before and after the experiment
In general, high-intensity training stimulates the secretion of cortisol, one of representative catabolic hormones, and increases the level of cortisol in blood, which performs opposite functions to testosterone, which is a representative anabolic hormone to induce muscular synthesis (Brillon et al., 1995). Lack of amino acid intakes over a long period of exercise stimulates the secretion of cortisol further, which had negative impacts on the growth of immunocytes (Shephard and Shek, 1994). Cortisol increases lipolysis in fat tissues and reduces protein synthesis in muscle tissues, thus increasing fat and amino acids in blood (Kraemer and Ratamess, 2005). It was reported that cortisol increased after resistance exercise (Jürimäe et al., 2006).
The present study found a significant increase to the cortisol concentration in both the groups after 6 weeks of weight reduction, thus matching previous studies. Testosterone, one of representative anabolic hormones, made a significant increase only in the experiment group. Given the decreasing and increasing T/C ratio in the traditional and experiment group, respectively, despite no statistically significant differences and the effects of testosterone and cortisol on muscle synthesis and muscle decomposition and immunity, respectively, the low weight reduction method is more desirable than the traditional high weight reduction method.
Nieman and Nehlsen-Cannarella (1991) suggested that 1-time middle-intensity exercise increased immunoglobulins and that high-intensity exercise decreased them. In the present study, there were no significant differences in two immunoglobulins IgA and IgM between the groups, but IgG made a significant decrease only in the traditional group. These findings imply that unlike the low weight reduction of the experiment group, the high weight reduction of the traditional group drops the immune functions of athletes and increases infection in the respiratory system.
Cytokine and CRP are representative indicators of inflammatory reaction. Cytokine is known to regulate immunity (Ballantyne et al., 2005; Chamorro, 2004). Stewart et al. (2007) reported that 12 weeks of combined exercise made a significant decrease to the cytokine concentration of common men including CRP, IL-6, and TNF-α. Phillips et al. (2010) reported that cytokine decreased after 10 weeks of middle- and high-intensity resistance training and that IL-6 increased after 6 hr of general resistance training. Smith et al. (2000) reported that high-intensity isometric exercise decreased IL-1β and increased IL-6 and TNF-α. Uchida et al. (2009) reported that resistance exercise had no impacts on cytokine. Unlike previous studies, the present study reported no changes to IL-6 in both the groups after the experiment and a significant increase to TNF-α and IL-1β. These opposite findings to previous studies are attributed to the fact that its subjects were elite bodybuilders, who had lower body fat percentage and did high-intensity exhaustive exercise, instead of common people.
Petersen and Pedersen (2005) reported that TNF-α was created in fat cells, stimulating the creation of IL-6 in fat cells and monocytes in bloods and that IL-6 increased the concentration of IL-1β and CRP. That is, these cytokines were closely related to fat cells. The reduction of body fat percentage through regular exercise can cause the reduction of these cytokines in common people with higher body fat percentage than bodybuilders. The present study, however, reported that these cytokines increased with no change to CRP in both the groups, which dropped in body fat percentage (both the groups dropped from mean 14% to 8.4% after the experiment; about 7.4% reduction) after 6 weeks of weight reduction. These findings imply that additional factors such as high-intensity exhaustive exercise or caloric restriction could have impacts on the changing concentration of cytokine or CRP in addition to weight or body fat reduction. There is a need for follow-up study to investigate them.
Of the subunits of WBC, only monocytes made a significant increase after 6 weeks of weight reduction (P=0.005). This increase was observed only in the experiment group. In general, the increase of WBC and its subunits mean the increase of inflammatory reaction, but it is unreasonable to interpret these findings as the outcome of inflammatory reaction because the present study found no significant increase to WBC and CRP as an inflammatory reaction happens due to the increase of WBC and CRP, one of representative inflammatory reaction indicators (Andersson et al., 2010).
It has been proposed that the increase of WBC’s subunits has something to do with the increase of epinephrine and cortisol (Pedersen and Hoffman-Goetz, 2000). In the present study, both the groups made a significant increase in cortisol after six weeks of weight reduction. The cortisol concentration was higher in the experiment group than the traditional group, which suggests that increasing cortisol had greater influences than increasing inflammatory reaction.
Changes to health promotion (muscular strength) variables according to the weight reduction methods (traditional vs. experimental) before and after the experiment
Bouchard et al. (1990) reported that many repeats at low intensity were effective for the reduction of fat mass in resistance training for greater muscular strength. Berger (1965) reported that weight training made a significant increase to muscular strength, which would in turn cause muscular hypertrophy. Given that high load weight training is more effective for the enhancement of muscular strength than low load weight training (Noble, 1986) and that there is a significant increase to muscular strength both in the resistance training group of fewer repeats and that of more repeats (Kokkinos et al., 1988), the low weight reduction method within the range of 6%±2% proposed in the study can minimize changes to muscular circumference or muscle mass or maintain them while causing no enhancement of muscular strength.
The present study investigated the effects of differences in daily food ingestion according to different weight reduction methods on the immune and health promotion functions of elite bodybuilders by analyzing various markers (hormone, cytokine, immunoglobulin, and leukocyte count) related to the immune functions and muscular strength indexes according to two different weight reduction methods (traditional one=high weight reduction vs. new one=low weight reduction) over 6 weeks (2 weeks for muscular separation and 4 weeks for muscular definition) of weight reduction. The analysis results led to the following conclusions.
The traditional group made a bigger decrease to weight and BMI over 6 weeks than the experiment group. While the experiment group made a slow increase to body water over the period, the traditional group made a slow decrease to it, which points to opposite pattern differences between them. There was a significant reduction in body fat percentage (%fat) in both the groups after the experiment unlike weight, body water, and BMI.
As for the interactive effects of the weight reduction methods on macronutrients, macrominerals, and antioxidants, the experiment group (6%±2%) maintained a certain level of food ingestion across various nutrients including energy or made a slow decrease to it, whereas the traditional group (16%±4%) made a rapid decrease to the intakes of various nutrients including energy due to their attempt at relatively greater weight reduction than the experiment group. These pattern differences resulted in interactive effects between them.
As for the immunity variables, the present study observed an increase to certain cytokines despite the traditional high weight reduction unlike previous studies with martial arts athletes. However, there was no excessive reduction of immunity or rapid decrease to the factors of body composition characteristics. These findings seem to be closely related to the food ingestion of bodybuilding athletes and have something to do with the selection of observation variables including the immunity variables as well as the timing of experimentation. Follow-up study is proposed on the topics.
The findings also imply that the low weight reduction method within the range of 6%±2% proposed in the study can minimize changes to muscular circumference or mass or maintain it. The information provided by the study will help bodybuilding athletes do training in a safer and healthier way. Today the obese population is growing due to the recent enhancement of social and economic conditions, excessive nutrient intakes according to the improved dietary life, and reduction of physical activities. Obesity is one of major factors to cause all kinds of adult diseases including hypertension, diabetes, and hyperlipidemia. There is thus a need for the right weight reduction method to facilitate health promotion through the management of adult obesity and the prevention or early treatment of adult diseases. The findings of the present study will hopefully serve as basic data for such efforts.
Notes
CONFLICT OF INTEREST
No potential conflict of interest relevant to this article was reported.