Effect of the body mass index and sexual difference on the muscle activity during trunk exercise: a preliminary study
Article information

Abstract
There was lack of study which evaluated the effects of characteristics of subjects such as the body mass index (BMI) or waist circumference (WC), as well as sexual differences on trunk muscle activities. The purpose of the present study was to compare the abdominal muscle activities among the groups dividing criterion as the BMI, WC, and the gender. As a criterion of BMI and WC, subjects were arranged to three groups. Female subjects who were less than 25 kg/m2 BMI, and less than 90 WC were arranged as female with underweight group (FU), male subjects who were greater than 25 kg/m2 BMI and greater than 85 WC were arranged as male with overweight group (MO), male subjects who were less than 25 kg/m2 BMI and less than 85 WC were arranged in male with underweight group (MU). Surface electromyography responses of the rectus abdominis, internal oblique, external oblique muscles and lumbar level of erector spinae were obtained during the plank and maximal voluntary isometric contraction (MVIC). The MO group showed significantly higher %MVIC value of the internal oblique and lumbar level of erector spinae, compared to the MU group (P<0.05). The %MVIC of the rectus abdominis was significantly greater with the FU group (P<0.05). There were significant differences in the root mean squared (RMS) values from MVIC among the three groups (P<0.05). Regardless of muscles differences, the MO group showed significantly lower RMS activity values than the FU and the MU groups (P<0.05). Present study indicates some considerations of interpreting surface electromyography (sEMG) signal from region overlapping large fat tissue especially for trunk muscles. Individual characteristics such as gender, BMI, and WC could affect the sEMG signals. The female and male with overweight represent relatively high %MVICs during exercise, but it might be due to relatively low RMS values from procedure of MVICs.
INTRODUCTION
As the one of the measurement variable, the unit of muscle activity is used for demonstrating specific effects of exercise as well as comparing groups, interventions. Among the measurement device for muscle activity, surface electromyography (sEMG) device is widely used for researches which are related to kinesiology, rehabilitation, and sports arena (Cram and Kasman, 1998; De Luca, 1997). Because the sEMG is noninvasive measurement tool, the sEMG has been used to quantify muscle activity during dynamic and static body movements.
Due to individual differences, anatomical and physiological factors could influence the EMG magnitude (Burden, 2010). Therefore, normalization techniques are often used in researches using the sEMG (Burden, 2010; Cram and Kasman, 1998; Hug, 2011). Hug (2011) discusses the appropriateness of using EMG recordings, and provided the cautions of interpreting sEMG signals. Burden (2010) specifically described the importance of normalizing sEMG in subject to healthy participant. The normalization method is simply the ratio of the task sEMG data to the sEMG used as the denominator in the normalization equation (Burden, 2010). Among the various reference values as denominator, the value from the maximal voluntary contraction is generally used for normalization procedure, especially for the researches investigating healthy participants.
One of factors disturbing the sEMG signals, the thick fatty tissue reduces the signals from muscle output, and contributes geographical changes of surface which the electrodes are attached (De Luca, 1997). Practically, some studies limited the characteristics of subject using criterion of body mass index (BMI), for preventing potential influence of fatty tissue reducing sEMG signals (Park and Yoo, 2014; Park et al., 2013). De Luca (1997) already indicated the amount of subcutaneous (fatty) tissue between the electrode and the active fibers determines the amount of spatial filtering to which the signal is subjected.
The waist fatty tissue in front of the abdominal cavity could disturb measuring activities of abdominal muscles with sEMG. There are two representative methods of indirectly estimating fatty tissue, which are the BMI and the waist circumference (WC) (Dong et al., 2016; Hamada et al., 2018). Although the BMI is more widely used for determine overweight and obesity, the WC is known as estimating abdominal fat more directly than does BMI. According to previous study classified the criterion about the WC and the BMI, 85 cm WC for male, and 90 cm WC for female, and criterion 25 kg/m2 as BMI (Hamada et al., 2018). Considering influences of these factors on muscular activity is important for preventing potential influence of disturbing sEMG signal, especially for study investigating trunk muscles.
However, there was lack of study which evaluated the effects of characteristics of subjects such as the BMI or WC, as well as sexual differences on trunk muscle activities. Previous studies suggest variations of trunk exercises for strengthening the abdominal muscles (Calatayud et al., 2017; Cortell-Tormo et al., 2017; Schoenfeld et al., 2014). Because almost all previous studies investigated the abdominal exercise effects on abdominal muscle activities in subject to participants with less 25 kg/m2 BMI regardless of sexual differences, in addition, there were necessary to examine these factors influenced the sEMG activities.
Present study has started from a simple question whether the individual factor of overweight and sexual difference affects the sEMG measurement so that the purpose of the present study was to compare the abdominal muscle activities among the three groups dividing criterion as the BMI, WC, and the gender.
MATERIALS AND METHODS
Participant
The sample size in present study was determined using G-power 3.1.3 software. Installing a significant level of 0.05, power of 0.8 using convenience sampling, participants were recruited from a local university. As an inclusion criterion, it was determined as participant with no musculoskeletal disorder during recent 6 months.
A total of 38 males and females participated in this study. Based on subject demographics, the BMI was calculated. As a criterion of BMI and WC, subjects were arranged to three groups. Female subjects who were less than 25 BMI, and less than 90 WC were arranged as FU group (n=15), male subjects who were greater than 25 kg/m2 BMI and greater than 85 WC were arranged as MO group (n=11), male subjects who were less than 25 kg/m2 BMI and less than 85 WC were arranged in MU group (n=12). Demographics of three groups were represented in Table 1. All participants gave informed written consent according to the protocol approved by Kaya University Faculty of Health Science Human Ethics Committee (Kaya IRB-219).

Demographic characteristics of participants
Instrumentation
sEMG data were collected using a wireless EMG system (Free EMG300, BTS Bioengineering, Milan, Italy). The sEMG signals were sampled with a 1,000-Hz frequency. The data obtained were computerized with the EMG acquisition software (BTS Bioengineering). Four surface electrodes were attached parallel to the muscle fibers on the dominant right side as follows: on the rectus abdominis muscle at approximately 3 cm lateral to the umbilicus; on the internal oblique muscle at approximately 1 cm medial to the anterior superior iliac spine; and on the lumbar level of erector spinae muscle at belly of the erector spinae at the 3rd lumbar spine, and 2 cm lateral to the spine at the level of the iliac crest (Cortell-Tormo et al., 2017; Cram and Kasman., 1998). Skin preparation of shaving and cleaning with alcohol was done for according to the SENIAM (Surface ElectroMyoGraphyfor the Non-Invasive Assessment of Muscles) recommendation.
Procedures
After 10 min of practice and rest time for acclimation to the exercise, the subject performed the plank exercise. The subjects were in the prone position and raised the pelvis from the table, with their body weight supported on the forearms and feet. Subjects were instructed not to elevate their hips, and to try to maintain the pelvic tilt angle. Subjects conducted two trials under exercise condition, and sEMG data were collected over a period of 10 sec controlled by metronome. The first and last 3 sec were eliminated, and the activity from middle of 4 sec was used for further analysis. The participants were allowed to rest 3 min between trials.
After providing sEMG data during the plank exercise, each subject performed two trials at maximal voluntary muscle contraction (MVIC) for the included muscles against manual resistance. The average value of the two MVIC trials was used for the normalization procedure and statistical analysis. Same as the plank exercise, sEMG data were collected over a period of 10 sec controlled by metronome. The first and last 3 sec were eliminated, and the activity from middle of 4 sec was used for further analysis. The participants were allowed to rest 3 min between trials.
Statistical analysis
The root mean square of sEMG data during the exercise was obtained with a widow length of 0.125 sec and averaged. The data are expressed as the %MVIC for the plank, and the RMS data from MVIC were represented as unit of mV. PASW Statistics ver. 18.0 (SPSS Inc., Chicago, IL, USA) was used to determine the significance of differences in %MVIC and RMS values among the groups. For identifying the normal distribution of data, the Kolmogorov–Smirnov test has been done before the statistical analysis. The one-way analysis of variance was performed to test for differences in %MVIC and RMS among the three groups. For the main effects derived via pairwise multiple comparisons, the Bonferroni correction was performed to identify specific differences among the three groups. In all analyses, P<0.05 was taken to indicate statistical significance.
RESULTS
The mean values of normalized EMG data and RMS data were represented in Table 2. The factor of group differences significantly affected the normalized sEMG data of rectus abdominis, internal oblique, lumbar level of erector spinae. The MO group showed significantly higher %MVIC value of the internal oblique and lumbar level of erector spinae, compared to the MU group (Fig. 1) (P<0.05). The %MVIC of the rectus abdominis was significantly greater with the FU group, compared to the MU group (P<0.05).
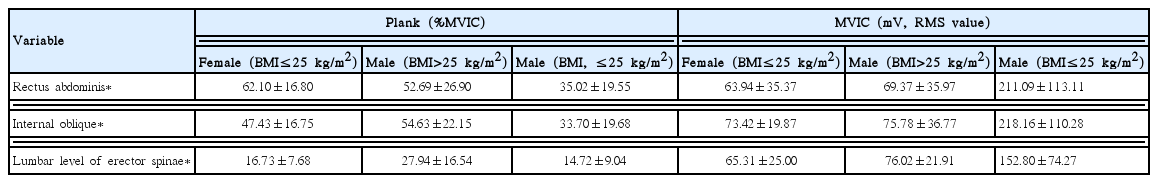
Descriptive statistics for maximum voluntary isometric contraction (MVIC), normalized EMG data (%MVIC) during the plank
The normalized electromyography data (%MVIC) of the rectus abdominis, internal oblique, and lumbar level of erector spinae during plank exercise. MVIC, maximum voluntary isometric concentration; BMI, body mass index. *P<0.05 significant difference among the groups.
The processed RMS data from MVIC procedure were also represented in Table 2. There were significant differences in the rectus abdominis, internal oblique, and the lumbar level of erector spinae among the three groups (P<0.05). Regardless of muscles differences, the MO group showed significantly higher RMS muscle activity values than the FU and the MU groups (Fig. 2) (P<0.05).

The root mean squared (RMS) data of the rectus abdominis, internal oblique, and lumbar level of erector spinae during maximal voluntary isometric concentration. BMI, body mass index. *P<0.05 significant difference among the groups.
DISCUSSION
This study investigated the effects of the individual characteristics as the BMI, WC, and the gender on the activation of the abdominal muscles during plank exercises. For preventing misinterpretation of sEMG signal, present study analyzed not only the %MVIC values during exercise but also the RMS values from the MVIC procedure.
The MO group which represents male group with overweight and large WC, showed higher %MVIC of the internal oblique and lumbar level of erector spinae than the MU group. In addition, The FU group which represents female with normal weight and WC showed greater %MVIC of the rectus abdominis than the MU group. Without the exaggeration of these results, overweight male participants and female participants has relatively greater effort of neuromuscular control on maintaining plank exercise positions. Compared to results of previous study investigating %MVIC in plank, both two groups showed relatively greater values of the %MVIC values. About the plank exercises, previous studies reported the %MVIC of rectus abdominis values ranged from 20 to 40, the %MVIC values of oblique muscle ranged from 30 to 50, the %MVIC values of erector spinae values ranged from 10 to 20 (Calatayud et al., 2017; Cortell-Tormo et al., 2017; Schoenfeld et al., 2014).
There are possible two assumptions to explain these results. The overweight participant group has relatively large mass of fat in front of the abdominal cavity, which required greater effort of trunk musculature with maintaining plank exercise. The female participants group has relatively thin muscle fibers compared to the male participants, so that the greater neuromuscular efforts are represented, in spite of same plank conditions enduring one’s body weight. Second explanation is the problem of the calculating %MVIC methods. For calculating %MVICs, measuring the maximal activity of targeted muscle is essential procedures (Burden, 2010). The behavior tests for trunk muscles include elevating one’s upper body against the gravity and resistance from examiner. In this conditions, folded waist mass could disturb the sEMG signal, especially for participants with overweight and large WC. In present study, the RMS data from MVIC contraction could support this 2nd assumption.
Present results indicated that the root mean squared data of the rectus abdominis, internal oblique, and lumbar level of erector spinae in maximal voluntary isometric contractions were significantly different among the groups. Regardless of muscle identifications, the MU group showed greater RMS values than other groups. Because this value is used for calculating %MVIC as denominator, the MU group acquiring high MVIC values tends to demonstrate low %MVIC values during plank exercise. In spite of considering 1st assumption affect the %MVIC values, it is difficult to affirm that this group differences from MVIC procedure did not affect the %MVIC values.
A few studies have investigated the abdominal muscle activity with subjects over 25 kg/m2 BMI (Comfort et al., 2011; Snarr and Esco, 2014). In our knowledge, however, there were no study which differentiates the group with criterion of BMI and WC. Only the two previous studies investigated the subjects with 25 kg/m2 BMI, but these subject characteristics were not primal considerations of these researches. Comfort et al. (2011) demonstrated the abdominal muscle activities during various strengthening exercises in subject to participants over 25 kg/m2 BMI in average. However, the values were presented with RMS values not with the %MVIC values. More recently, Snarr and Esco (2014) also investigated the plank with suspension device in subjects to participants over 25 kg/m2 BMI in average. In this results of previous study reports similar %MVIC values during regular plank compared to other studies. Because both of two previous researches proceed with the amateur athlete with training regularly, the direct comparison to present results is impossible.
The present study examined the effects of gender differences, BMI and WC on trunk muscle activities. The results highlighted the problem of interpretation of sEMG signals through normalization procedure. However, several limitations should be addressed by future studies. The most important limitation was that the group with female over 25 kg/m2 BMI and 90 WC could not be included, due to failure of recruiting. Second, we could not record kinetic data from pelvic region, so the fixation of pelvis during plank could not be supported.
In summary, there are some considerations of interpreting sEMG signal from region overlapping large fat tissue especially for trunk muscles. Individual characteristics such as gender, BMI, and WC could affect the sEMG signals. The female and male with overweight represent relatively high %MVICs during plank, but it can be due to relatively low RMS values from procedure of MVICs. Therefore, there is necessity of reflecting individual characteristics such as gender, BMI, and WC for interpreting sEMG signal.
Notes
CONFLICT OF INTEREST
No potential conflict of interest relevant to this article was reported.
ACKNOWLEDGMENTS
This research was supported by Basic Science Research Program through the National Research Foundation of Korea (NRF) funded by the Ministry of Education, Science and Technology (No. 2017R1C1B5075994).