Effect of type II collagen extract on immunosuppression induced by methotrexate in rats
Article information

Abstract
This study investigated the effect of type II collagen extract on SD rats with deteriorated immunity caused by methotrexate. The test samples were dosed once a day for 28 days by gastric gavage at dosage 250 mg/kg and 500 mg/kg after methotrexate treatment, and the changes on body weight, total blood leukocyte numbers, the percentages of B-cells, CD4+ T-cells and CD8+ T-cells in the blood and spleen were observed. The changes on body weight, the total blood leukocyte numbers, the total lymphocyte numbers in the spleen, the ratio of CD4+ and CD8+ T-cells in the blood and spleen were increased significantly in type II collagen extract groups as compared with the control group. According to the above results, type II collagen extract has an effect of increasing immune responses on rats with deteriorated immunity caused by methotrexate.
INTRODUCTION
Immunity is a term derived from Greek immurus, which means exemption from heavy burdens or taxes. It can be regarded as an action that induces an appropriate bioreactor to effectively prevent external invasion. In Korean medicine, this immune effect is explained by nutritional and tonic effect. They are biological response modifiers that can directly or indirectly increase the decreased immune function. It is known to play an important role in maintaining homeostasis. This can be closely related to the immunological concept of modern medicine (Hong et al., 1999).
There are many immune cells in the body to perform immune function, and these cells are located in various tissues and organs of the body including blood, lymph nodes, spleen and gastrointestinal tract. Immune cell members include lymphocytes, mononuclear cells, polynuclear leukocytes and platelets. Among them, the main cells responsible for the immune response are lymphocytes and mononuclear cells.
In particular, the lymphocyte proliferative capacity is considered to be an immunological index as a result of cell division as well as new DNA synthesis generated by various kinds of stimuli including various mitogens, antigens, cytokines, and growth factors (Baek et al., 1996). Cytokines act as regulatory mediators of innate immunity that stimulate or inhibit inflammatory responses, produced during the activation and specific stages of natural and specific immunity. And, they recognize specific antigens and are secreted by T cells (Lee et al., 2000; Lee et al., 2002). It is known that the immune response plays an important role in the immune response and the inflammatory response.
Type II collagen has been classically recognized as the indispensable collagenous component in cartilage, and plays a critical role in the development and maturation process of chondrocytes. Thus, type II collagen has drawn more attention and interest in the treatment and research of rheumatoid arthritis, osteoarthritis and auto immune diseases. Recently, some studies have reported that type II collagen embedded with adipose-derived stem cells or chondrocytes can promote cartilage repair in a inflammatory cartilage defect model in vivo (Lazarini et al., 2017).
Therefore, we investigated the effect of type II collagen extract on the immune function. Methotrexate (MTX) was used to induce immunosuppression in rats, and type II collagen extract was administered to measure the body weight, total leukocyte, B cell ratio in the spleen, and the change of CD4+ and CD8+ T cell ratio in the spleen and blood were observed.
MATERIALS AND METHODS
Animals and reagents
The animals were Sprague-Dawley male rats weighing 120±20 g and were fed a solid diet (21.1% crude protein, crude fat 3.5%, crude fiber 5.0%, crude protein 8.0%, calcium 0.6%, phosphorus 0.6%). All experiments were conducted according to guidelines of the Animal Use and Care Committee of Semyung University (No. Smecae-08-01). The reagent used in this experiment was type II collagen extract obtained by Gupup Inc. (Seoul, Korea).
Classification of experimental groups
Experimental groups were divided to normal group, control group, low dose treated group, and high dose treated group. The normal group fed only solid feed and water. The control group was administered MTX in the same environment as the normal group. In the low and high dose treated groups, MTX was administered in the same manner as the control group, and the type II collagen extract was orally administered.
Immune degradation using MTX
MTX (Sigma Chemical Co., St. Louis, MO, USA) extract was dissolved in physiological saline and injected intraperitoneally into experimental animals. The main dose was 2 mg/kg, and 1 mL was injected for once a day for 4 consecutive days.
Reagent administration
From the day after the last day of inducing immune degradation by MTX administration, type II collagen extract was orally administered at 250 mg/kg per day in the low dose treated group and 500 mg/kg per day in the high dose treated group for 28 consecutive days. The control group was orally administered the same amount of saline.
Measurement of body weight
The body weights of the experimental animals were measured four times, 1st week, 2nd week, 3rd week, and 4rd week after the last day of MTX administration.
Blood sampling
The animals were anesthetized with chloroform, cardiac puncture and blood was added to the bottle containing ethylen diamine tetraacetic acid dipotassium salt (EDTA) to prevent coagulation.
Preparation of splenocytes
After cardiac blood culture, the abdomen was completely covered with 70% alcohol, and we took spleen out of the rat’s body, and the tissues around the spleen were carefully removed. After washing twice with Rosewell Park Memorial Institute (RPMI)-1640 (GibcoBRL, Grand Island, NE, USA) medium at 4°C, the spleen was minced on a petridish containing RPMI-1640 and the spleen was carefully rubbed into the sterilized glass membrane to float the splenocytes. This suspension was filtered through a stainless steel wire mesh (mesh No. 100: Cheonggye Sangong Co., Seoul, Korea) to remove tissue pieces and unlabeled cell masses, and washed once with RPMI-1640 in Hanks balanced salt solution (HBSS, GibcoBRL). After hypotonic shock with the sterilized distilled water, the red blood cells were completely hemolyzed, washed twice with 10× HBSS and once again with RPMI-1640 medium, and the spleen cells were resuspended in the mixed medium supplemented with 10% fetal bovine serum (FBS).
Measurement of B cell ratio in the spleen
The heart-collected blood was placed in an EDTA tube and 100 μL was placed in a 12×75 test tube. After adding 0.1 μL of fluorescein isothiocyanate (FITC) anti-rat CD4 monoclonal antibody (Pharmingen, San Diego, CA, USA), 0.5 μL of PE anti-rat CD45R/B220 monoclonal antibody (Pharmingen) was added and mixed with vortex mixer. The test samples were centrifuged at 1,000 rpm for 5 min. The supernatant was discarded, 2 mL of washing solution (phosphate buffered saline, PBS) was added, and the mixture was centrifuged at 1,000 rpm for 5 min. The supernatant was discarded, and the test samples were added 500 μL of PBS and mixed well with a vortex mixer, and analyzed using a flow cytometer (Becton Dickinson, Franklin Lakes, NJ, USA).
Measurement of CD4+ and CD8+ T cell ratio in spleen and blood
The test samples were placed in an EDTA tube and 100 μL was placed in a 12×75 test tube. After adding 0.5 μg of FITC anti-rat CD3 monoclonal antibody (Pharmingen), the test samples were added 0.1 μL of PE Anti-Rat CD4 or CD8 monoclonal antibody (Pharmingen) and mixed with vortex mixer. The test samples were added 2 mL of lysing solution (FACS lysing solution, Becton Dickionson) and left for 15 min. The test samples were centrifuged at 1,000 rpm for 5 min. The supernatant was discarded, 2 mL of washing solution (PBS) was added, and the mixture was centrifuged at 1,000 rpm for 5 min. The supernatant was discarded, and the test samples were added 500 μL of PBS and mixed well with a vortex mixer, and analyzed using a flow cytometer (Becton Dickinson).
Cell culture
Cells of the murine machophage RAW 264.7 were purchased from the American Type Culture Collection. Cells were cultured in Dulbecco’s modified eagle’s medium (Gibco BRL, Grand Island, NY, USA) supplemented with 10% FBS (Gibco BRL) at 37°C in 5% CO2 incubator (MCO-17AIC, Sanyo, Tokyo, Japan).
Cell viability measurement
Cell viability was determined using the 3-(4,5-dimethylthiazol-2-yl)-2,5-diphenyltetrazolium bromide (MTT) assay kit (Boehringer Mannheim GmbH, Mannheim, Germany) as per the manufacturer’s protocols. In order to determine the cytotoxicity of type II collagen extract, cells were treated with 25, 50, 100, and 200 μg/mL for 24 hr. Cultures of the control group were left untreated. Ten μL of the MTT labeling reagent was added to each well, and the plates were incubated for 4 hr. Solubilization solution of 100 μL was then added to each well, and the cells were incubated for another 12 hr. The absorbance was then measured with a microtiter plate reader absorbance was then measured with a microtiter plate reader (Bio-Tek, Winooski, VT, USA) at a test wavelength of 195 nm and a reference wavelength of 690 nm. Optical density (O.D.) was calculated as the difference between the absorbance at the reference wavelength and that at the test wavelength. Percent viability was calculated as (O.D. of drug-treated sample/control O.D.) ×100.
Nitric oxide production measurement
In order to determine the effect of type II collagen extract on nitric oxide (NO) synthesis, the amount of nitrite in the supernatant was measured using a commercially available NO detection kit (Intron Biotech., Seoul, Korea). After collection of 100 μL of supernatant, 50 μL of N1 buffer was added, and the plate was incubated at room temperature for 10 min. N2 buffer was then added, and the plate was incubated at room temperature for 10 min. The absorbance of the content of each well was measured at 450 nm. The nitrite concentration was calculated from a nitrite standard curve.
Statistical analysis
Results are expressed as mean±standard deviation. Data were analyzed by one-way analysis of variance followed by Duncan post hoc test using SPSS ver. 11.0 (SPSS Inc., Chicago, IL, USA). Differences were considered statistically significant at P<0.05.
RESULTS
Body weight change measurement
We observed the changes of body weight (Table 1). As a result of the measurement, there was a significant increase in the low and high doses of type II collagen extract treated groups compared to the control group treated with MTX in the 1st and 2nd week. And, there was a significant increase in the low dose of type II collagen extract treated groups compared to the control group.

Body weight changes
Changes in total leukocyte counts
The changes of total leukocyte counts were observed (Fig. 1). The results were 11.51±3.78 in the normal group, 4.11±1.28 in the control group, 8.03±1.09 in the low dose group and 10.48± 1.40 in the high dose group. Therefore, a statistically significant increase was observed in the experimental group treated with low and high doses type II collagen extract compared to the control group treated with MTX.
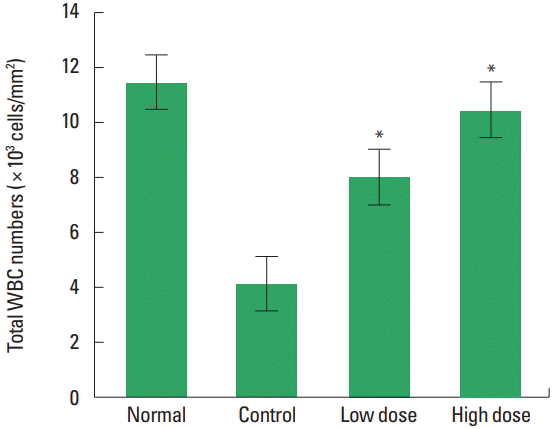
The changes of total leukocyte counts on type II collagen extract in methotrexate (MTX)-induced immunosuppressed rats. Normal, untreated group; Control, treated with MTX group; Low dose, treated with MTX and type II collagen extract (250 mg/kg) group; High dose, treated with MTX and type II collagen extract (500 mg/kg) group. *P<0.05 compared to the control group.
Measurement of CD4+ cell ratio in blood
The changes of CD4+ cell ratio in blood were observed (Fig. 2). The results were 45.10%±6.16% in the normal group, 37.8%± 4.21% in the control group, 33.66%±3.05% in the low dose group and 45.65%±4.07% in the high dose group. In contrast to the control group, no statistically significant increase was observed in the low and the high doses type II collagen extract treated groups.
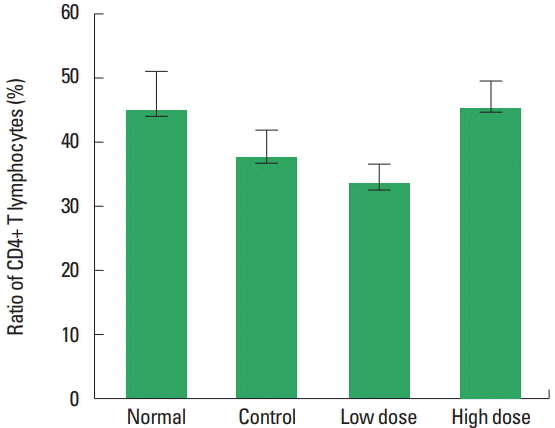
The changes of CD4+ T lymphocytes on low and high dose of undenatured type II collagen extract in methotrexate (MTX)-induced immunosuppressed rats. Normal, untreated group; Control, treated with MTX group; Low dose, treated with MTX and type II collagen extract (250 mg/kg) group; High dose, treated with MTX and type II collagen extract (500 mg/kg) group.
Measurement of CD8 + cell ratio in blood
The changes of CD8+ cell ratio in the blood were observed (Fig. 3). The results were 20.80%±1.77% in the normal group, 12.38%±1.25% in the control group, 14.78%±0.72% in the low dose group and 24.54%±1.93% in the high dose group. There was a statistically significant increase in the high dose type II collagen extract treated group compared to the control group.

The changes of CD8+ T lymphocytes on type II collagen extract in methotrexate (MTX)-induced immunosuppressed rats. Normal, untreated group; Control, treated with MTX group; Low dose, treated with MTX and type II collagen extract (250 mg/kg) group; High dose, treated with MTX and type II collagen extract (500 mg/kg) group. *P<0.05 compared to the control group.
Measurement of B cell ratio in the spleen
The changes of splenocyte B cell ratio in the spleen were observed (Fig. 4). The results were 40.84%±1.41% in the normal group, 24.62%±1.54% in the control group, 35.50%±4.12% in the low dose group and 41.40%±1.74% in the high dose group. There was a statistically significant increase in the low and the high dose type II collagen extract treated group compared to the control group.

The changes of B lymphocytes in the spleen on type II collagen extract in methotrexate (MTX)-induced immunosuppressed SD rats. Normal, untreated group; Control, treated with MTX group; Low dose, treated with MTX and type II collagen extract (250 mg/kg) group; High dose, treated with MTX and type II collagen extract (500 mg/kg) group. *P<0.05 compared to the control group.
Measurement of CD4+ cell ratio in the spleen
The changes of spleen CD4+ cell ratio in the spleen were observed (Fig. 5). The results were 39.06%±4.71% in normal group, 20.83%±2.17% in control group, 25.84%±0.94% in low dose group and 35.01%±2.91% in high dose group. There was a statistically significant increase in the low and the high doses type II collagen extract treated groups compared to the control group.

The changes of CD4+ ratio in the spleen on type II collagen extract in methotrexate (MTX)-induced immunosuppressed SD rats. Normal, untreated group; Control, treated with MTX group; Low dose, treated with MTX and type II collagen extract (250 mg/kg) group; High dose, treated with MTX and type II collagen extract (500 mg/kg) group. *P<0.05 compared to the control group.
Measurement of CD8+ cell ratio in the spleen
The changes of spleen CD8+ cell ratio in the spleen were observed (Fig. 6). The results were 14.20%±1.25% in the normal group, 4.80%±1.09% in the control group, 10.41%±1.13% in the low dose group and 15.65%±0.67% in the high dose group. There was a statistically significant increase in the low and the high doses type II collagen extract treated groups compared to the control group.
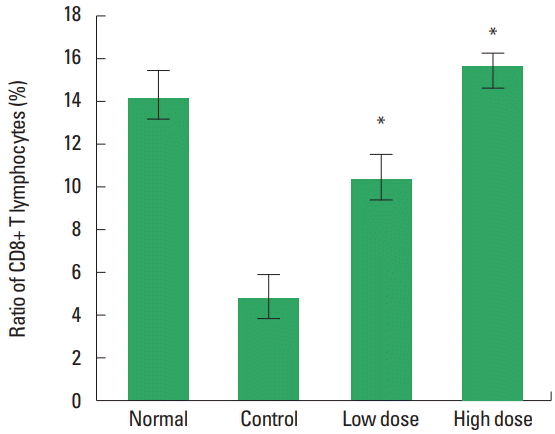
The changes of CD8+ cell ratio in the spleen on type II collagen extract in methotrexate (MTX)-induced immunosuppressed SD rats. Normal, untreated group; Control, treated with MTX group; Low dose, treated with MTX and type II collagen extract (250 mg/kg) group; High dose, treated with MTX and type II collagen extract (500 mg/kg) group. *P<0.05 compared to the control group.
Measurement of cell viability
The cell viability rates were observed (Fig. 7). The cell viability rates at 62.5, 125, 250, 500, and 1,000 μg/mL of type II collagen extract were 101.15%±4.18%, 101.73%±4.40%, 104.83%± 2.24%, and 99.54%±6.14% and 98.27%±10.27%, respectively. The results showed that the type II collagen extract showed no statistically significant toxicity in RAW264.7 macrophages at the concentrations of 62.5, 125, 250, 500, and 1,000 μg/mL.
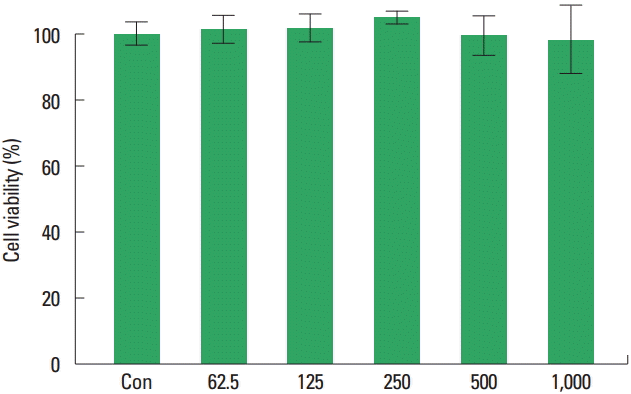
The effect of collagen type II extract on the cell viability of RAW264.7 cells. Con, untreated group; 62.5, 125, 250, 500, and 1,000, treated with each concentration (μg/mL) of collagen type II extract.
Measurement of NO production
The inhibitory effect of type II collagen extract on NO production in RAW264.7 macrophages was measured (Fig. 8). The NO production rate of the group treated with lipopolysaccharides (LPS) alone increased to 151.15%±3.30%. In the group treated with LPS and type II collagen extract at the concentrations of 62.5, 125, 250, 500, and 1,000 μg/mL, they were 137.81%± 5.38%, 131.64%±6.08%, 124.47%±3.66%, 111.86%±7.93%, and 102.45%±7.22%, respectively. They were significantly decreased compared with the LPS-treated group.
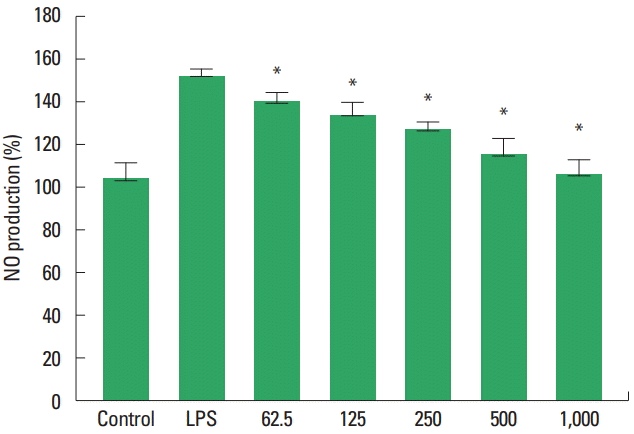
Effects of type II collagen extract on the nitric oxide (NO) production in RAW264.7 cells. Control, untreated group; Lipopolysaccharides (LPS), treated with LPS (1 μg/mL); 62.5, 125, 250, 500, 1,000, treat with LPS and each concentration (μg/mL) of type II collagen extract. Values are relative to the control. *P<0.05 indicate a significant different from the LPS.
DISCUSSION
There are two types of immunity: innate and acquired (or adaptive). Acquired immunity requires a prior exposure to an antigen and involves antibodies and lymphocytes. It is dependent on memory and recognition of prior pathogens with antigen-specific memory cells generating a more forceful responses on re-exposure. This system is therefore typically slower in its initial response to attack with 72–96 hr required to generate specific T cells and antibodies (Ahn et al., 2015; Matarese et al., 2003).
These acquired immune responses can be divided into humoral immune responses by B lymphocytes and cell mediated immune responses by T lymphocytes (Ahn et al., 2015). B lymphocytes are precursor cells of antibody-producing plasma cells. Mature B lymphocytes roughly account for 10%–15% of peripheral blood lymphocytes, 50% of splenic lymphocytes, and 10% of bone marrow lymphocytes. T lymphocytes act as mediators in cellular immune responses and mature T lymphocytes account for 70%–80% of peripheral blood lymphocytes, 90% of thymocyte lymphocytes, 30%–40% of lymph node cells, and 20%–30% of splenic lymphocytes. T-lymphocytes are composed of helper T-lymphocytes, cytotoxic T-lymphocytes, suppressor T-lymphocytes and delayed-type hypersensitivity T-lymphocytes (Ahn et al., 2015).
Helper T lymphocytes are the cells that regulate the immune response. They are also called CD4 cells because they have CD4 on the cell surface. All blood cells and immune cells are differentiated from a single primitive cell called hematopoietic stem cells. As the hematopoietic stem cells differentiate, each surface of immune cells expresses a unique type of cell surface protein. We refer to this as the CD, which refers to a group of monoclonal antibodies specific for various markers of lymphocyte differentiation (Kralickova and Vetvicka, 2015; Paul Dmowski and Braun, 2004). CD4 is a cell surface protein that is a marker of helper T lymphocyte. It plays an important role in recognizing antigenic peptides bound to the type 2 major histocompatibility complex (MHC) of T cell receptors. It binds to the side of the type II MHC and acts as a coreceptor. CD8 is a cell surface protein that is part of cytotoxic T lymphocytes and inhibitory T lymphocytes, and plays an important role in recognizing antigenic peptides bound by T cell receptors to type I MHC. It binds to the side of the type 1 MHC and acts as a co-receptor (Berkkanoglu and Arici, 2003).
The antigen receptor on the surface of T lymphocytes is called T-cell receptor. It reacts only with MHC/peptide complexes that have been treated by antigen-presenting cells and bound to the surface of antigen-presenting cells with the types 1 and 2 MHC. CD4 is an adjunct to the formation of type 2 MHC and CD8 is also associated with type 1 MHC (Senturk and Arici, 1999).
CD4 increases adhesion to antigen presenting cells (APCs) or target cells by specific affinity of MHC T lymphocytes for molecules in T lymphocyte activation. It is involved in the initial signal transduction pathway that occurs when T lymphocytes recognize MHC/peptides in APC (Berkkanoglu and Arici, 2003). Thus, the association of the attachment and signal transduction functions of CD4 coreceptors greatly enhances the efficiency of mature T lymphocytes and antigen stimulation. Immunity can be quantified using antibodies against the labeling protein on the surface of lymphocytes that play such roles (Anderson et al., 1990; Hofmann et al., 1996). It is also widely used as a marker of general immunity (Chiappelli et al., 1991; Everaus, 1992).
MTX is currently being used as an anticancer drug, rheumatoid drug, and immunosuppressive agent, and has an excellent effect on choriocarcinoma. The mechanism of MTX inhibits DNA synthesis by inhibiting folic acid reductase. In the immunosuppression model by MTX, it is generally known to evaluate the efficacy of immunologically active substances by observing changes in body weight, changes in B lymphocytes in spleen cells and blood, changes in CD4+, CD8+ cells (Artym et al., 2004).
Inflammation is a defense mechanism of the host and this response is known to be the most important response in the macrophage-mediated immune response (Kim and Kim, 2015). Nuclear transcription factor-kappa B (NF-κB), an important factor in inflammatory responses, is a transcription factor that regulates the synthesis of various cytokines. NF-κB enters the nucleus and acts as a transcription factor to induce inflammatory cytokines such as inducible nitric oxide synthase (iNOS), interleukin-6 (IL-6), IL-1α, and IL-1β. And various inflammatory mediators such as NO are produced (Lee et al., 2012). NO has various physiological functions such as body defense function, signal transduction function, neurotoxicity, and vasodilation. NO is synthesized by three types of NOS: neuronal nitric oxide synthase, endothelial nitric oxide synthase, and iNOS. Among these NOS, NO production by iNOS is absolutely high, and it plays an important pathological role. It has been reported that iNOS is expressed in various cells such as macrophage when exposed to external stimuli to produce large amounts of NO. Prostaglandin E2 promotes the expansion of blood vessels and permeability of blood vessel walls and stimulates the secretion of inflammatory cytokines such as IL-6, as well as aggregating immune cells into inflammatory sites (Lee et al., 2012).
In order to investigate the effect of type II collagen extract on the immune function, we investigated the changes of the body weight, leukocyte count, blood CD4+, CD8+ cell ratio, spleen CD4+, and CD8+ cell ratio in MTX-induced immunosuppressive rats. Cell viability and NO production of type II collagen extract were also observed.
Body weight was significantly increased at 1st and 2nd weeks after type II collagen extract administration, but not at 3rd and 4rd weeks. Leukocyte counts were significantly increased in the experimental group treated with low and high doses type II collagen extract treated group compared to the control group induced with MTX treatment. As a result of the measurement of CD4+ cell ratio in the blood, the experimental group administered with high dose type II collagen extract was significantly increased compared to the control group induced by MTX administration. As a result of the CD8+ cell ratio in the blood, the experimental group administered with the low and high doses type II collagen extract was significantly increased compared with the control group induced by MTX administration. As a result of the spleen B cell ratio, the experimental groups administered with low and high doses type II collagen extract were significantly increased compared to the control group induced with MTX administration. As a result of measuring the CD4+ cell ratio in the spleen, the experimental groups administered with the low and high doses type II collagen extract were significantly increased as compared with the MTX-induced experimental group. In addition, the concentration of CD8+ cells ratio in the spleen was significantly increased in the experimental groups administered with the low and high doses type II collagen extract compared to the experimental group induced with the MTX administration.
These results suggest that the type II collagen extract may contribute to changes in leukocyte counts caused by MTX and changes in CD8+ cell ratio in the blood. It was also confirmed that there was a significant effect on the changes of B cell ratio, CD4+ and CD8+ cell ratio in the spleen. In addition, the type II collagen extract did not show cytotoxicity, and it was also confirmed that the inhibition of NO production was significant. Therefore, it is thought that type II collagen extract may help to restore the immune function in the living body caused by impaired immune function.
Notes
CONFLICT OF INTEREST
No potential conflict of interest relevant to this article was reported.
ACKNOWLEDGMENTS
This work was supported by the Strat-up Growth Technology Development Program (S2402431) funded by Korea Technology and Information Promotion Agency for SMEs.