Effects of socioeconomic status, health behavior, and physical activity on the prevalence of metabolic syndrome
Article information

Abstract
Routine medical checkups have been provided by both the government-led and private hospitals for the purposes of prevention and early detection of diseases. Various studies were conducted with clinical results obtained from both government and private hospital based results. However, results from two types of health checkups have not been conducted. The results should be compared for the prevalence of metabolic disease in the aspects of socioeconomic status and health care behaviors to observe the pros and cons of two types of health checkups. Routine health checkup results of the National Health and Nutrition Survey (1,593 men, 2,180 women) and a private hospital (12,823 men, 7,070 women) of the year 2012 were used for the study. Education level and monthly household income were used to assess the socioeconomic status. Alcohol consumption, smoking, and International Physical Activity Questionnaire were used to assess health behaviors. Logistic regression analysis was applied (P<0.05). Participants of the private hospital had significantly greater household income, education level, amount of physical activity and intensity, and number of nonsmokers. Women showed no differences in the amount of vigorous physical activity. The prevalence rates of metabolic syndrome showed similar results. Education level, physical activity, and alcohol consumption were significantly associated in men of the government group. Smoking showed significant influence in men of both groups. Education level, alcohol consumption, and smoking showed significant influence in women of the government group. Participants who conducted government-led health examinations showed stronger influence of socioeconomic level and health behaviors on metabolic syndrome especially in men.
INTRODUCTION
Various researches have been conducted on the preventive effects of regularly conducted health screening and early detection for proper treatment. Such a medical service system plays a vital role in reducing the medical cost and the mental burden on general population as well as the nation. Such medical system also allows individuals to care for their individual health more closely for preventative care (Kim, 2008; Lee et al., 2009; Yeo and Jeong, 2012). In Korea, routine health checkups are carried out in individually selected private hospitals with government regulated health care system.
The National Health Insurance Corporation (NHIC) in Korea has been providing regular free health checkups to all eligible head of households and household members aged 20 years or older since the establishment of the NHIC in 2000. The major goal of the planned screening was to prevent or initially detect serious complications such as cancer or adult disease. However, providing free health checkups to all eligible persons led to several limitations, including limited quality and selections of the examination items. Since the number and type of government-provided free checkup items are fixed for all persons, additional or detailed examinations need to be paid individually (Choi and Hwang, 2011).
To overcome these limitations and understand the health status of people of the nation, the headquarter of the Center for Disease Control (CDC) under the Ministry of Health and Welfare, regularly conducts the National Health and Nutrition Survey. The results of the examination are statistically analyzed to construct fundamental health related information of the population. The CDC conducts nation-wide tour to provide free health checkups which include various in-depth health examinations. Such free health checkups have been provided to preselected households and household members. However, the number of participants is low compared to the nation-widely conducted regular health screening because the examination targets a randomly selected sample population.
Unlike the government-led health checkups, those who use the private hospitals for customized health checkups can include health examination items depending on the choice of the individual which can include relatively expensive or in-depth examinations. With noticeable economic growth in Korea, interest for personal health care has been gradually increasing along with the market for private health care in recent years. However, the degree of personal interest in health care varies based on the personal interest and financial condition (Baek and Jung, 2006). The socioeconomic and physical environment of an individual obtaining the health care service not only affects the individual health and health-related behaviors, but also affects the amount of interest in health care (Kim, 2007). Higher income has been reported to be associated with lower prevalence and early disease detection rate as well as lower mortality rate. Moreover, upon the incidence of disease, those with better financial and social status show comparatively lower severity in disease and health-related cost burden for both the individual and nation (Foraker et al., 2011; National Center for Health Statistics, 2012).
In particular, metabolic syndrome can be progressed to hypertension, heart disease, and cerebrovascular disease in the future. Through a routine health examination, metabolic syndrome or related items can be detected for early detection or prevention into secondary complications (Cornier et al., 2008; Mottillo et al., 2010). Although metabolic syndrome has been reported to be influenced by dietary habit, smoking, drinking, or physical inactivity, people with good socioeconomic status have been known to be more aggressive in health care and prevention (Matthews et al., 2008). Therefore, socioeconomic status seems to influence individual health care and prevention into serious complications. Although there have been many studies using data from routine health examinations, there have not yet been any studies that compare the results of the government-led health examinations and the results of privately conducted health examinations. Therefore, this study was designed to investigate the effects of sex, economic status, educational level, smoking, drinking, and physical activity intensity and frequency with prevalence of metabolic syndrome.
MATERIALS AND METHODS
Participants
Results of the government-led and privately conducted health checkups of the year 2012 were analyzed for the study. Data were collected from the National Health and Nutrition Survey (1,593 men, 2,180 women) and the private health examination data were collected from a hospital-based health examination center (12,823 men, 7,070 women) were used. Both institutions prepared questionnaires that included medical history, drug consumption, drinking, smoking, and physical activity related questions before the actual examination. In order to protect privacy of the participants, identifiable personal information was deleted prior to assessment. Only the data of those who agreed to use data for the research purpose were used. Institutional Review Board approval was obtained from the Asan Medical Center for this study (approval number: 2016-0084). The participants of the government-led health checkup were grouped as the government group and the participants of the private hospital health checkup were grouped as the private group.
Socioeconomic status
Socioeconomic status information composed of monthly household income and final educational level. Monthly household income was divided into 5 million, 7 million, 10 million, and over 10 million Korean won per month, and the educational level is divided into junior high school graduate, high school graduate, and college or greater graduate.
Health behavior questionnaires
Health checkup data from two different institutions were organized to compare the results with same standards. Drinking or alcohol consumption information were organized by frequency and quality based on the World Health Organization (WHO) standard. When alcohol consumption was calculated with the average amount of alcohol consumption per day in Korea, more than once-a-week of alcohol consumption was considered to be of high risk (World Health Organization, 2000). Therefore, participants who consumed alcoholic beverage more than once a week were classified as the high-risk group and those who consumed alcoholic beverage less than once-a-month were classified as the low-risk group. Unlike alcohol consumption, smoking was classified by either smoking or nonsmoking or the high risk or low risk group. Both institutions utilized the International Physical Activity Questionnaire (IPAQ) developed by the WHO to assess the degree of physical activity participation. The questionnaire classified physical activity as vigorous intensity, moderate intensity, and walking and further obtained information of time and frequency (International Physical Activity Questionnaire, 2005).
Frequency per week was used to assess lifestyle behavior in this study. In terms of physical activity frequency, the subjects who did not participate in either vigorous intensity or moderate intensity physical activity at all were classified as 0 day, the subjects who participated in low amount of physical activity of 1–2 days were classified as ‘1–2 days,’ and the subjects who participated in moderate amount of physical activity of 5–7 days were classified as ‘5–7 days.’ In addition, the subject who did not walk at all were classified as ‘no exercise,’ the subjects who participated in physical activity 0–2 days were classified as ‘low activity,’ the subjects who participated in physical activity 3–4 days were classified as a ‘moderate activity,’ and the subjects who participated in physical activity 5–7 days were ‘high activity.’
Metabolic syndrome
In this study, the National Cholesterol Education Program - Adult Treatment Panel III standards were utilized as the criteria to classify metabolic syndrome. As for the waist circumference, the WHO Asian standard was applied (Expert Panel on Detection, Evaluation, and Treatment of High Blood Cholesterol in Adults, 2001; World Health Organization, Western Pacific Region, 2000). Triglyceride level of ≥150 mg/dL and cholesterol levels of <40 mg/dL and <50 mg/dL were used for used for men and women, respectively, to assess dyslipidemia. Blood pressure of ≥130/85 mmHg was used to assess high blood pressure. Fasting blood glucose level of ≥110 mg/dL was used to assess diabetic status. Abdominal obesity was classified by the waist circumference of ≥90 cm and ≥80 cm for men and women, respectively. Metabolic syndrome was diagnosed when more than 3 items out of 5 items were applied.
Data analyses
Data analysis was performed using IBM SPSS Statistics ver. 21.0 (IBM Co., Armonk, NY, USA). Continuous variables were divided by mean and standard deviation, and categorical data were divided by percent. Men and women were separately analyzed and independent t-test and chi-square statistical methods were used to analyze health characteristics and behavior results. The prevalence of metabolic syndrome was assessed by logistic regression analysis with age, health behaviors, and socioeconomic status as correction parameters. The significance level is set at P<0.05.
RESULTS
Table 1 shows the general characteristics of the participants. Mean ages of the government and private groups were 52.4±7.3 and 49.9±11.4 years (P<0.05), and 51.0±7.4 and 49.5±11.2 years for men and women, respectively. In the case of height and weight, men of the government group were taller and greater. Women of the government group had greater weight than the private group (P<0.05). Men of the government group had comparatively high high-density lipoproteins (HDL) cholesterol level and greater waist circumference. Women of the government group had higher blood pressure, waist circumference, triglyceride level, blood sugar level, and hemoglobin A1c level than the private group. The metabolic syndrome incidence rates of men were 29.6% for the private group and 32.1% for the government group. The incidence rate of the metabolic syndrome in women of the private group was 11.3% while women of the government group was 25.3%.

Characteristics of the subjects
The socioeconomic status of participants is shown in Table 2. The household income was generally high for the private group. 43.1% men and 40.8% women of the private group earned more than 10 million Korean won (KRW) a month, while 4.8% men and 4.1% women of the government group learned more than 10 million KRW a month (P<0.01). In terms of education, 78.5% men and 62.9% women of the private group were college or higher-level graduates. On the other hand, 35.5% men and 25.8% women of the government group were college or higher-level graduates.
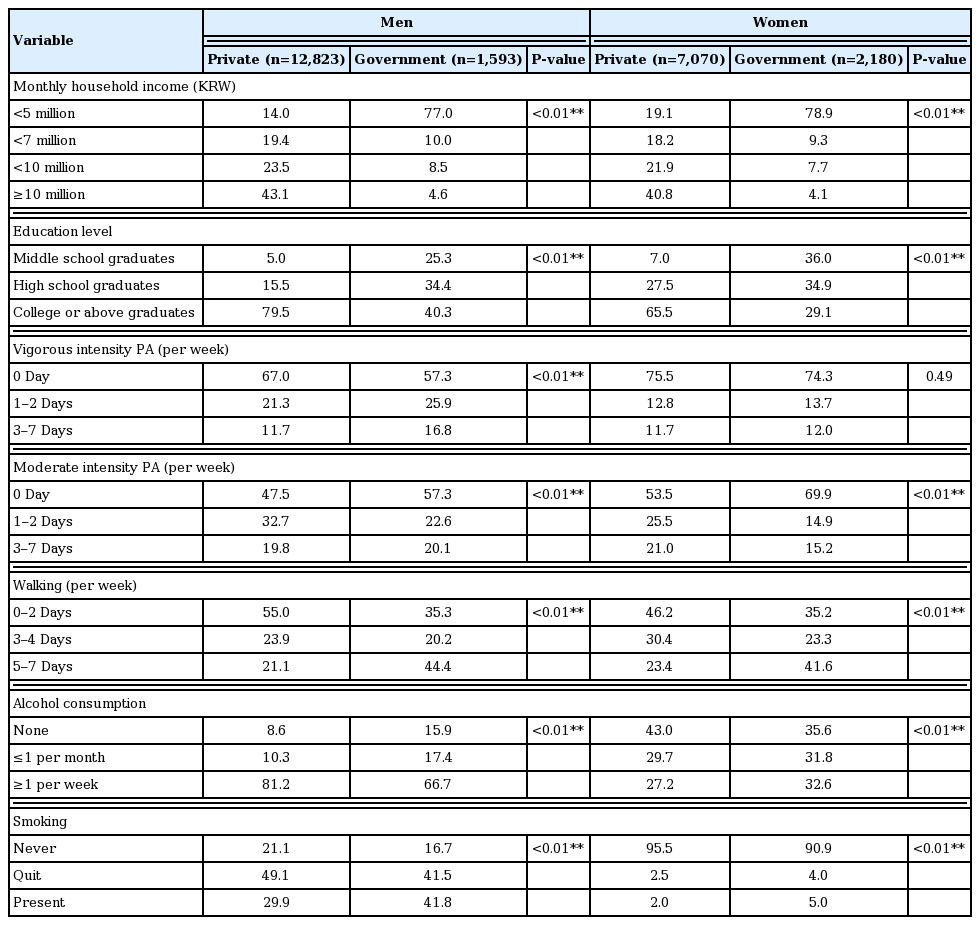
Socioeconomic and health behavior status of the subjects
Fifty-three point eight percent (53.8%) men and 64.9% women of the government group and 45.0% men and 64.6% women of the private group participated in walking 3 or more days per week. Participation rates of vigorous intensity physical activity by the government group and private group were 11.7% and 16.8%, respectively. Significant difference between women of the two groups was not observed.
Smoking rate was high for men than women overall. However, the number of current women smokers was high for the government group than the private group. The rates of women smokers were 5.0% and 2.0% for the government and private groups, respectively. As for the alcohol consumption rates, 81.2% and 66.7% men of the government and private groups drank more than once a week. As for women, 27.2% and 32.6% of the government and private groups consumed alcohol once a week (P<0.01) (Table 2).
The prevalence rate of metabolic syndrome was significantly higher depending on the level of education, the amount of physical activity, smoking, and drinking status for men of the private group (Table 3). As for the men of the government group, significances were observed only for walking and smoking. The odd ratio of the college or higher-level graduates in comparison to the middle school graduates was 0.816 (P=0.02) for the private group. The odd ratio of smoking in comparison to nonsmoking was 1.590 (P<0.01) for the private group. In addition, the odd ratio of men participating in vigorous physical activity was 0.799 (P<0.01) than men who did not participate in vigorous physical activity for the private group. The odd ratio of more frequently walking men in comparison to less frequently walking men was 0.612 (P<0.01) for the government group. In terms of smoking, the odd ratio of currently smoking men was 1.522 (P<0.01) in comparison to the nonsmoking men for the government group.
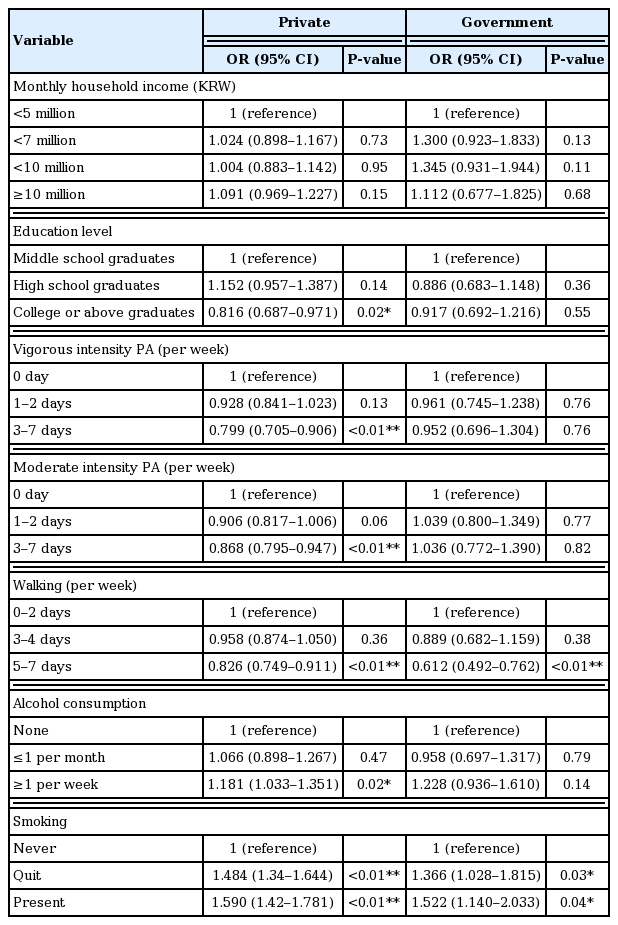
Prevalence of metabolic syndrome by odds ratio according to the socioeconomic status and health behaviors in men
The prevalence of metabolic syndrome was significantly different depending on the household income, education level, smoking and drinking for the women of the private group (Table 4). The prevalence of metabolic syndrome was significantly different depending of the education level for the women of the government group. The odd ratio of those with income of more than 10 million KRW per month was 0.727 (P<0.01) in comparison to those with income of less than 5 million KRW per month for the government group. The odd ratio of the college or higher-level graduates was 0.579 (P<0.01) in comparison to those with less education level.

Prevalence of metabolic syndrome by odds ratio according to the socioeconomic status and health behaviors in women
There was no significant difference in the amount of physical activity. In terms of smoking, the smokers had about 2 times higher prevalence rate than the nonsmokers. The subjects who drink more than once a month were 1.3 times more likely to have metabolic syndrome than those who did not drink alcohol at all. Women of the private group showed significance in the education level. The odd ratio of the college or higher-level graduates was 0.411 (P<0.01) in comparison to the middle school graduates.
DISCUSSION
The increase in the elderly population and the increase in interest in health are the major phenomena currently emerging in Korea. Medical services are largely preventive medical examinations before outbreaks and illnesses are aimed at treating diseases. The necessity of health checkups has been acknowledged by the government a while ago and the government enforced general health checkups and workplace health checks under the supervision of the National Health Insurance Corporation have been conducted 30 years ago. One of the main reasons for selecting the government-led health checkup is the cost-effective nature of the preventative care (Maciosek et al., 2006). Basic medical check-ups are free but obligatory, and those who are not enrolled in the nationally conducted health screening pool may be disadvantaged in the event of illness. This is aimed at reducing the burden and suffering of the individuals as well as the nation by early detecting and preventing serious complications (Jo and Ahn, 2013). However, health checkups conducted by private hospitals operated by private clinical institutions are relatively expensive due to limited insurance coverage. Test items include precise and expensive examinations compared to those conducted by national health inspections (Hur and Hwang, 2014). These two forms of health screening are selected individually according to the need such as financial capability, health concerns, and efficiency. The most important criterion for the use of health services in health care is financial capability, which is also depended upon the desire of the patient and existence of illness (Moon and Lee, 2001).
The purpose of this study was to examine the differences in health-related concerns and prevalence of metabolic syndrome among people who had participated the government-lead free health checkups. Data from the National Health Examination Survey were used by the National Health and Nutrition Examination Survey conducted by the National Health Insurance Corporation. In this study, the age of the participant was significantly higher in the private health screening users. This can be explained by the greater age range and household income of those who conduct private health screenings. The amount of economic activity and interest in health are greater in this group. Although there is a significant difference in the general characteristics, the numerical difference of the actual measured values is not large. However, the waist circumference was greater, and the HDL-C level was higher in the private health screening group of men. Although this may be partly due to the difference in age of the groups, the amount of active social participation may have played significant role. In addition, it may have been predictable in this study since the proportion of the household income earners over 10 million KRW per month was more than 40% as in previous study (Kim, 2007). In addition, the main indicators such as blood pressure, abnormal lipid profile, and blood glucose levels of the government group were comparatively poor in women. One of the reasons may be due to the comparatively lower socioeconomic level of women than men in this study. Although 36.0% of women were middle school or lower graduates, 29.1% of women were college or higher graduates.
In the present study, men of the private group showed significant difference in the education level (odds ratio, 0.816; P=0.02) but not in the household income. On the other hand, household income and education level were both significant for women of the private group. In terms of government group, although the significance was not shown in the socioeconomic status of men, the significance was shown in the education level of women. Such results indicated that the education level was more influential in prevalence of metabolic syndrome than the household income in women over men. Similar results were obtained in previous studies. Significant difference was observed in the education level among women but only in men (Dunstan et al., 2005). Influence of education level was more prevalent in a study with exclusively women (Wamala et al., 1999). It could be assumed that stronger influence of education level on metabolic syndrome in women over men is because of more diverse influential factors such as alcohol consumption and smoking affect men than women.
The incidence of overall metabolic syndrome was higher in men than in women, and this is consistent with the higher incidence of cardiovascular disease and its risk factors (dyslipidemia, obesity, high fasting blood sugar, and blood pressure) in men (Regitz-Zagrosek et al., 2006). More involvement in social and economic activities and related environmental factors may influence increased prevalence of metabolic syndrome risk factors in men (Mabry et al., 2010). However, the socioeconomic status of women influenced prevalence of metabolic syndrome than man in this study. Considering the high alcohol consumption rate of 81.2% and low nonalcohol consumption rate of 8.6% of men in the government group, social activity participation seems to be influential.
The final analytical consideration was physical activity and metabolic syndrome. In general, most of the physical related researches observe frequency of physical activity participation per week. However, both the government and private health related surveys utilized IPAQ provided by the WHO which obtains information of intensity of physical activity (vigorous, moderate, and walking). Men of the government group showed significantly lower prevalence rate of 17% to 20% through vigorous, moderate, and walking intensity of physical activity participation. Women showed no significance between physical activity participation and metabolic syndrome prevalence. Women usually participate in walking over moderate to vigorous physical activity. Except in minor number of results, most of the previous study results reported of strong metabolic prevention effects (Rennie et al., 2003).
Current study showed significant effect of walking in men but not in women. Although physical activity has been known to be a representative health promotion activity, some studies have reported that physical activity did not have a significant effect on disease prevention. Moreover, body mass index corrected odd ratio calculation did not show significant influence of moderate intensity of physical activity on metabolic syndrome (Rennie et al., 2003). However, participation of moderate to vigorous intensity of physical activity may have significant influence over prevalence of metabolic syndrome.
There are several limitations to this study. First, data utilized for this study were of limited organizations. Although several types of government-led nationally conducted health examinations exist such as workplace or government employee health checkups. This study analyzed randomly sampled National Health and Nutrition Survey data. The private health examination data also had limitation. Data of only one organization which provides one of the most expensive health checkup services in Korea was used for comparison in this study. In addition, the data of the private group was mainly composed of middle-age to old-aged individuals while the data of the government group was composed of uniformly distributed different age groups. Since metabolic syndrome is known to be increased with advanced age, results may have been biased due to different age distribution ranges. For future analysis, it may be necessary to adjust the conditions of the populations in a similar manner through propensity score matching statistical methods. In addition, by comparing the results with similarly segmented age groups, the characteristics of health care behaviors according to socioeconomic differences may have shown different results. In addition, physical activity was analyzed using frequency of participation instead of intensity and duration of physical activity participation.
People in Korea must consider cost over effectiveness when considering either the government-led or private hospital-based health examinations. This study analyzed the prevalence of the metabolic syndrome according to the socioeconomic status, health care activity, and physical activity intensity of individuals who had participated government-led or private hospital conducted health examinations. The socioeconomic level of the individuals of the private group was high, and the incidence of the metabolic syndrome was also lower than that of the government group. The prevalence of metabolic syndrome of women was more significant in relationship with the socioeconomic status than in men. Men of the private group who had been participating in moderate to vigorous intensity physical activity showed 17%–20% decrease in metabolic syndrome incidence rate. Therefore, the results indicate socioeconomic effects on prevalence of metabolic syndrome.
Notes
CONFLICT OF INTEREST
No potential conflict of interest relevant to this article was reported.