Effect of a professional soccer match in skin temperature of the lower limbs: a case study
Article information

Abstract
The purpose of this study is to analyze the relationship between lower limbs skin temperature (Tsk) recorded by infrared thermography and creatine kinase (CK) response following an official soccer game. A professional soccer player, from the first division Brazilian League, defender, 27 years and 183 cm of height was analyzed. Measures of Tsk with a thermal camera and blood CK concentrations were obtained 24 hr before (24H-PRE), 24 (24H-POST) and 48 hr (48H-POST) after an official match. The results showed that CK values were 193 U/L 24 hr before, rising to 1,083 U/L 24 hr after the game and 414 U/L 48 hr after the game. Anterior thigh Tsk was 31.5°C, 33.8°C, and 31.8°C in the moments 24H-PRE, 24H-POST, and 48H-POST, respectively. Similarly, anterior leg presented temperature of 31.2°C, 33.3°C, and 31.5°C at the same moments. Qualitative analysis of the thermograms showed that whole lower limbs are much warmer 24 hr after the match and certain areas as the right anterior thigh, the left anterior leg, both anterior ankles, and both posterior thighs have not fully recovered their initial Tsk 48 hr after the match. The results of this study indicate that participation in a professional soccer match can lead to significant increases in Tsk values measured by IRT 24 hr after the match. Considering this variable as an indicator of muscular damage, it could help in the process of training control, being part of an injury prevention program in professional soccer clubs.
INTRODUCTION
Participation in a soccer match results in a large number of microinjuries originated by the eccentric mechanical actions, generating muscle fibers ruptures, cell membrane damage, and sarcomeric degeneration (Hyldahl and Hubal, 2014; Kanda et al., 2013). Following this process, an acute local inflammatory response is triggered involving the release of different cytokines, migration of neutrophils to the trauma areas, and then releasing certain agents into the damaged fibers to attract macrophages that ingest and digest the dead tissue (Mohr et al., 2016; Walsh et al., 2011).
Increases in local tissue vascular activity following these inflammatory processes have been reported (Paulsen et al., 2012). In fact, some signs are produced by the body in this acute inflammatory response such as: heat, redness, pain, and these are generally noted after soccer matches (Paulsen et al., 2012; Young et al., 2012). Moreover, due to the greater vascular activity and the heat increase generated by the exercised muscles, it has been suggested that skin temperature (Tsk) recorded by infrared thermography (IRT) on the exercised body regions could be a good indicator of muscle stress (Hildebrandt et al., 2010). Thus, considering that the development of injury prevention program in professional soccer players requires reliable and fast information to address the level muscle damage and its location, we analyzed the relationship between lower limbs Tsk variation recorded by IRT and creatine kinase (CK) response following a soccer game. This analysis may help to understand the local thermal response after soccer match, expanding the view to the muscular damage response generated by matches, and helping to analyze exercise load.
MATERIALS AND METHODS
Participant
The analyzed athlete is a defender, with right dominant leg, nonsmoker, and member of a first division club of Brazilian Soccer League (age, 27 years; height, 183.0 cm; percentage body fat, 10.8%; body surface area, 1.92 m2; and V̇O2max, 54,7 mL/min/kg). Two weeks before the game, the participant underwent a medical examination in which he completed a health history questionnaire, and had his body weight, height, body fat, and V̇O2max assessed. He participated in at least six training sessions per week (mean, 2 hr) and played at least one match per week. No recent history of febrile illness, muscle lesions, lower limb trauma, and metabolic diseases, and no consumption of performance-enhancing supplements and medications for at least 6 months before the study were reported. The volunteer was informed about the procedures at all stages of the study and signed an informed consent form prior to the start the study. This study was approved by the local Ethics Committee on Human Research (No. 50708915.6.0000.5149) of the BLINDED, which followed the principles outlined by the World Medical Assembly Declaration of Helsinki.
Procedures
The body mass in grams (anthropometric mechanical scale, Welmy, São Paulo, Brazil), height in centimeters (stadiometer, Welmy) and skinfolds (subscapular, triceps, pectoral, axillary, suprailiac, abdominal and thigh) in millimeters (Lange, Santa Cruz, CA, USA) were measured by a trained anthropometrist according to the recommendations of the International Society for the Advancement of Kinanthropometry (Marfell-Jones et al., 2006). The values of each fold were used to obtain the sum of the folds and to calculate the percentage of fat according to the equation proposed by Jackson and Pollock (1978). The body surface area was calculated from the body weight and height measurements, according to Du Bois and Du Bois (1989). The V̇O2max was evaluated indirectly through the YoYo Endurance Test (level 2) (Bangsbo, 1994). This is specific test for soccer and intermittent sports (Krustrup et al., 2003), which the total distance traveled is positively related to athletes’ aerobic capacity (Castagna et al., 2006).
The analyzed athlete participated in a full official match in a field with natural grass (105 m×68 m) which took place between 1,600 and 1,800 hr. The mean temperature and humidity during the game were 27°C 60% respectively, according to Brazilian National Institute of Meteorology (www.inmet.gov.br). In the day before and 2 days after the game, no physical exercise was performed. However, on the game day, a normal soccer warm-up was performed before and a normal cool-down period after.
Data collection was performed in three different moments: (a) 24 hr before an official match of the First Division Brazilian League, (b) 24 hr after the start of the match, and (c) 48 hr after the match. At all times, CK data and thermal images were collected at the same time of the day (1,600 hr).
Thermograms were collected in a room properly equipped with artificial fluorescent lamps, and the environmental temperature was maintained through a heating/cooling air conditioner (Hi-wall Split, Komeco, São Paulo, Brazil). The average temperature remained at 24.2°C±0.5°C, and the relative humidity was 55.3%±3.5%; both measures were recorded with a digital weather station and anemometer (AD-250, Instrutherm, São Paulo, Brazil) with null (≅0.2 m/sec) wind speed.
The participant was previously instructed to avoid alcohol beverages, caffeine, large meals, ointments, cosmetics, and showering for 4 hr before the assessment. He was positioned away from any source of infrared radiation (e.g., electronic devices, lightning) or airflow (e.g., under an air conditioning unit). After remained standing for 10 min with the legs uncovered in the test room for acclimation (Marins et al., 2014b), he was positioned in an anatomical position at 3-m distance in order the cover 75% of the region of interest within the image. The camera was turned on 30 min prior to the test to allow sensor stabilization following the manufacturer’s guidelines and the images were recorded perpendicularly to the region of interest. An infrared imager (FLIR T420, FLIR Systems Inc., Wilsonville, OR, USA) with a measurement range from −20°C to+120°C, 2% accuracy, sensitivity ≤0.05°C, IR spectral band of 7.5 to 13 μ, refresh rate of 60 Hz, auto-focus and a resolution of 320×240 pixels was used to obtain the thermograms.
For the collection of two thermograms (anterior and posterior regions of the body), body regions of interest (ROI) were selected manually in a specific software (FLIR Tools, FLIR Systems Inc.), with rectangles of 10-cm width×20-cm height on the thighs (right and left) and 7-cm width×19-cm height on the legs (right and left), as reported in previous studies (Marins et al., 2014a; Marins et al., 2014b). The emissivity value adopted for human skin was 0.98 and the reflected temperature was set as 23°C in the thermal camera.
In order to determine the enzymatic concentration of CK in plasma, the fingertips of the player was cleaned with 95% ethanol and dried with cotton. A lancet was used with an automatic puncture trigger and 32 μL of capillary blood were collected into a heparinized capillary tube (Reflotron®) and immediately pipetted into a reactive strip of CK (Reflotron®) and inserted into the Reflotron Analyser (Reflotron, Zürich, Switzerland).
Data analysis
The analysis of the images considered both the mean temperature values of the selected areas of interest (quantitative analysis) and the visual analysis considering the visible heat points in the thermogram (qualitative analysis). All theses analyzes were carried out by a trained thermographer (level 1 accredited by Infrared Training Center).
RESULTS
Figs. 1 and 2 present the thermal images recorded at the different moments in anterior and posterior views respectively.
Thermograms of the anterior views: (A) 24 hr before the match, (B) 24 hr after starting the match, and (C) 48 hr after starting the match.

Thermograms of the posterior views: (A) 24 hr before the match, (B) 24 hrafter starting the match, and (C) 48 hr after starting the match.
Table 1 shows the mean Tsk values of the right and left thighs and legs (right and left) in the anterior and posterior views at the different moments analyzed, as well as the delta (Δ) of the Tsk of the first moment compared to the second moment (Δ PRE-24) and of the first moment compared to the third moment (Δ PRE-48). The CK values obtained were 193 U/L 24 hr before, rising to 1,083 U/L 24 hr after the game and 414 U/L 48 hr after the game.
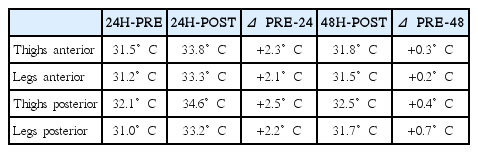
Mean skin temperature of the thighs (right and left) and legs (right and left) in the anterior and posterior view at the different moments analyzed, as well as the delta (Δ) of the initial moment compared with the second moment (Δ PRE-24) and with the third moment (Δ PRE-48)
On the other hand, considering that the thermal range of the thermograms were fixed between 28°C and 36°C, using qualitative analysis of the image it is possible to observe clearly how the whole lower limbs are much warmer 24 hr after the match and certain areas as the right anterior thigh, the left anterior leg, both anterior ankles, and both posterior thighs have not fully recovered their initial Tsk 48 hr after the match. Additionally, both posterior legs are colder than in the initial thermogram 48 hr after the match.
DISCUSSION
The results of the case study indicate that participation in a professional soccer match may result in significant increases in Tsk values recorded 24 hr after the game compared to the prematch data collected 24 hr before the match. In addition, results also indicate that Tsk turns to values close to those recorded before the match 48 hr after its completion.
We can hypothesize that participation in a soccer match results in a marked number of muscular microinjuries that could be linked to an acute inflammatory local response, given the high value of CK and Tsk founded. The analysis 24 hr after the match showed a CK value of 1,083 U/L which is considered extremely high for male athletes (Mougios, 2007) and increments between 2.1°C and 2.5°C in all the considered ROI. In addition, the evolution of the Tsk appears to be similar to CK, with a increase 24 hr after the match and returning to prematch levels 48 hr after. These results indicate the acute response and the recovery process considering the conditions in term of sleeping, feeding, and resting.
The increment of the Tsk values for all the considered ROI in this study case were higher than 2.0°C 24 hr after the game, reaching 2.5°C in the posterior region of the thighs. However, this appears to be a natural and normal condition for elite athletes after participating in an official soccer match. It is important to highlight that the studied athlete underwent medical clinical evaluation after the match and there was no evidence or complaint of injury, reinforcing the hypothesis that Tsk increases after the match was due to the inflammatory process (Mohr et al., 2016).
The images (Figs. 1, 2) show clearly that the adductor region, precisely one of the most susceptible to injury in soccer, presents the higher temperature 24 hr after the match and the thigh present several high temperature spots that could be related with local muscle damage mainly in the anterior thighs and in the right posterior thigh. On the other hand, certain areas as the right anterior and posterior thigh, the left anterior leg and the anterior ankles did not recovered the baseline Tsk as in the rest of the ROI. It is also quite interesting that the posterior legs become colder than the reference values 48 hr after the match. This could be an individual response of the athlete related to the personal adaption to allow a better recovery after the extreme effort performed during the match. Overloading those regions before the full recovery could generate an increased risk of injury to that player on those areas.
It is worth noting that unlike the CK analysis that presents a general idea of muscle damage, the thermogram can determine the locations where the microinjuries and inflammatory process are most acute after an intense training session or a match, and thus, the possible imbalances caused by the maximal exercise could be early detected. This point is crucial within an injury prevention program, which in the specific case of soccer may have a significant economic impact by preventing a player from having an injury.
Strategies for injury prevention in athletes require a broad understanding of physical effort effects and possible regions susceptible to injury. In this way, further studies with a higher number of athletes should be developed with the purpose of proving the indicatives pointed out in this case study, verifying the relationship between CK levels, as indicator of muscle damage, and Tsk recorded by IRT in different population groups.
The results of this study indicate that participation in a professional soccer match can lead to significant increases in Tsk values measured by IRT 24 hr after the match. Considering this variable as an indicator of muscular damage, it could help in the process of training control, being part of an injury prevention program in professional soccer clubs.
ACKNOWLEDGMENTS
The authors of this article thank the following research funding agencies: Federal Institute for Education, Science and Technology of Minas Gerais (IFMG); Coordination for the Improvement of Higher Education Personnel (CAPES); Foundation for Research Support of the Minas Gerais State (FAPEMIG); National Council of Scientific and Technological Development (CNPq).
Notes
CONFLICT OF INTEREST
No potential conflict of interest relevant to this article was reported.