Physiological adaptations induced by swimming in mice fed a high fat diet
Article information

Abstract
This study examined physiological variables of animals fed with a high-fat diet (HFD) or with a normal diet (ND) subjected to swimming at low and moderate level. Over 16 weeks, a group of animals was fed with HFD or ND, and at the 8 weeks, they started swimming with 50% or 80% of the maximum load achieved in the progressive work test. Weekly, body weight and the amount of ingested food were registered. The glycemic level was measured at the beginning, middle and at the end of the experiment. Adipose tissue, gastrocnemius muscles and hearts were collected for morphometry. The results showed that the animals fed an HFD had a minor caloric intake; however, the HFD increased body weight and adiposity, likely causing cardiac hypertrophy and an increase in the glycemic level. In this context, swimming with an 80% load contributed positively to weight control, adiposity, glycemic level, to control cardiac hypertrophy and induce hypertrophy in the gastrocnemius muscle. All parameters assessed showed better results for the ND animals. Therefore, the importance of fat consumption was emphasized in relation to obesity onset. The practice of swimming with an 80% load produced greater benefits than swimming with a 50% load for overweight treatment.
INTRODUCTION
The World Health Organization defines obesity as a chronic systemic disease with an increasingly high incidence worldwide (American Medical Association, c1995–2017). In 2014, nearly two billion adults worldwide were considered overweight and, of these, more than half a billion were obese (individuals with body mass index [BMI] ≥30 kg/m2) (World Health Organization, c2017b).
A high-fat diet (HFD) refers to a diet with more than 30% fat in its components (Hariri and Thibault, 2010). This type of diet causes a systemic inflammatory process present in obese people (Visser et al., 1999; Vgontzas et al., 2000). In addition, diets rich in saturated and trans fats lead to adverse metabolic effects on blood pressure, cholesterol, triglycerides, and insulin resistance, which in turn, can increase the risk of heart disease, ischemic stroke and type 2 diabetes mellitus.
To achieve optimum health, the median BMI for an adult population should be in the range of 21 to 23 kg/m2. Treatment must be preventive, because once obesity has affected an organism, few therapeutic tools have positive effects (Safer, 1991; Weintraub et al., 1992). The prevention of severe obesity involves an attempt to reduce the consumption of fat, especially saturated fat, and increase physical activity levels.
Scientific evidence documenting the notion of physical activity as a promoter of health appeared only at the end of the 19th century and beginning of the 20th century, when epidemiological studies demonstrated that individuals who are physically less active were more prone to develop heart diseases (revised by MacAuley, 1994). Since then, much evidence has supported the therapeutic role of physical activity in the reduction of body weight and of the risk for cardiovascular diseases, as well as in the production of benefits for some types of cancer and for emotional health (Ekelund et al., 1988; Subramanian et al., 2013).
It is well known that obesity is an inflammatory condition affecting various body tissues, yet interestingly at the same time the practice of exercise, can positively influence this situation, decreasing systemic inflammation (Petelin et al., 2014), adiposity as well as improving general health (Langbein et al., 2015; Misra et al., 2008; Sørensen et al., 2010). The American College of Sports Medicine recommends that most adults engage in moderate cardiorespiratory exercise training (between 50%–70% maximum volume of oxygen [VO2max]) for ≥30 min a day on ≥5 days a week, vigorous-intensity cardiorespiratory exercise training (high than 70% of VO2max) for ≥20 min a day on ≥3 days a week, or a combination of moderate- and vigorous-intensity exercise (Garber et al., 2011). On the other hand, for obese people, who have a higher incidence of cardiovascular disease and hypertension, high intensity exercise can result in an increased risk of mortality (Miller et al., 2015). In this case, supervised physical training performed at 50 % VO2max or lactate threshold for 60 min, 3 or 5 times a week is more recommended and secure. Animal models of obesity induced by diet represent an excellent opportunity to study various protocols of exercise that could be used for preventing or treating obese humans. Considering that the exercise is preventive and a therapeutic method for obesity, the present work studied the physiological adaptations caused by swimming (at low or moderate/high intensity) in mice fed a high fat diet.
MATERIALS AND METHODS
Animals, diets, and training
Male Swiss mice (n=64) were obtained from the Biotery Center and Animal Experimentation and housed on a 12-hr light/dark cycle (inverted) and temperature of 22°C±1°C with water and standard rations given to the rodents ad libitum. This study was approved by the Institutional Committee for Ethics in Animal Experimentation (CEUA/UFU, protocol 063/11) in accordance with the guidelines of the Brazilian College for Animal Experimentation.
At the age of 5 weeks, the animals were divided into two experimental groups. In the first group (normal diet [ND]), the animals were fed a standard diet and in the second group, they were fed a HFD (Table 1) over 16 weeks. After the first 8 weeks, each group was separated into four groups that participated in different activities. In this way, we formed the following groups: sedentary, swimming without a load, swimming with 50% of the maximum load attached to the tail, and swimming with 80% of the maximum load attached to the tail. It is important to highlight that the diet and type of activity were maintained until the end of the 16th week, when the animals were euthanized (Fig. 1).
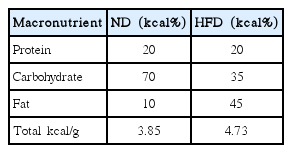
Diet macronutrients of normal diet (ND) and high fat diet (HFD)
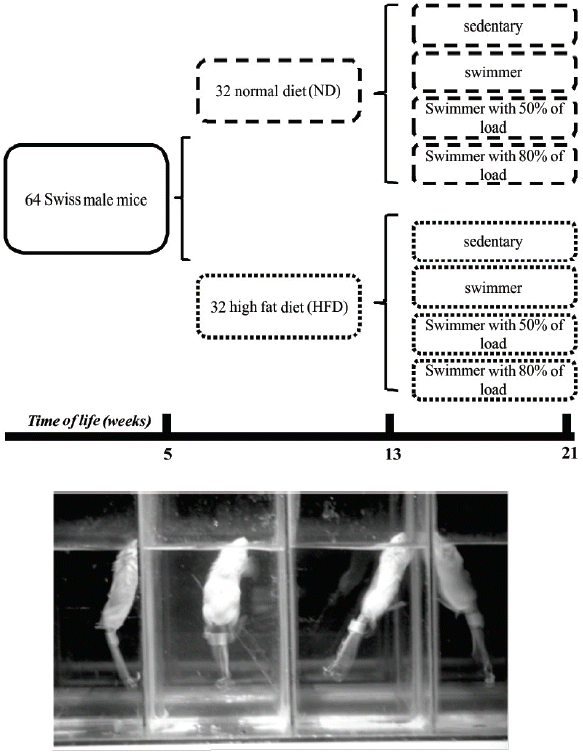
Distribution of the groups and aquarium with animals in aquatic training.
The physical activity used in the training protocol was swimming (Fig. 1). The training sessions were performed during the dark cycle, between 7:00 a.m. and 7:00 p.m., and all animals were trained during the same period throughout the experiment. The temperature of the water was maintained at 32°C±3°C (Evangelista et al., 2003). The exercise duration was of 1 hr/day for 5 days/week over 8 weeks, in which the first week included free swimming for 10 min to habituate the animals with the new environment, followed by 7 weeks of effective training.
During the training period, the animals were weekly submitted to a progressive load test (incremental) to determine the most adequate load to be used. The test consisted of increasing additions to the load corresponding to 2% of the animal’s body weight, added every three minutes until animal exhaustion during swimming (Almeida et al., 2009). The intensity of the exercise training was set at 50% or 80% of the maximum load obtained in a progressive test.
Physiological variables analyzed
Weekly, in addition to the data collected in the progressive load test (time of resistance in seconds and load reached in grams), the body weight and food intake of the animals were measured in grams (Shimadzu, Kyoto, Japan). To monitor the quantity of food ingested, the animals were kept in individual cages and the quantity of food offered, as well as the remains of the same, were measured weekly. The difference between these two measures was considered the value corresponding to the quantity of food ingested by the animal.
The glycemic level was measured in three different moments (mg/dL, Contour Bayer glucometer, Bayer AG, Leverkusen, Germany): the first measurement was taken at the beginning of the experiment, the second at the end of the first eight weeks, and the third at the end of the 16 weeks.
For euthanasia, the animals were anesthetized with a mixture of diazepam (Cristalia, São Paulo, Brazil), ketamine, and xylazine (Syntec, São Paulo, Brazil) (1:2:2). After the loss of the corneal and dorsalis pedis reflexes, the animals were perfused via the heart with 50 mL of buffered saline solution. Then, the visceral (kidney, mesenteric) and periepididymal fat were extracted for measurement (g; Shimadzu, Kyoto, Japan) and expressed in % of body weight (adiposity). In addition, the gastrocnemius muscle of the right paw and heart were removed and, together with the periepididymal adipocytes, were processed for morphometry.
Morphometric analysis of tissues
The removed tissues were kept in a fixative solution for 12 hr and processed routinely, included in paraffin, and sectioned into 5-μm-thick samples by a microtome. Sections were stained with hematoxylin and eosin and documented for morphometry with ImageJ software version 1.50i (Wayne Rasband National Institute of Health, Bethesda, MD, USA).
The morphometric analysis consisted of a measurement of an area (μm2) of 50 cells from three sections of each animal. For the gastrocnemius muscle, the middle region of the belly was used; for the heart, the middle region of the left ventricle was used; and for the fat tissue, a random area was chosen. Sequentially, the arithmetic mean was calculated for each individual and group.
Statistical analysis
Depending on data distribution, we used an analysis of variance one and two-way test with a Bonferroni posttest or the Mann–Whitney U-test, considering a significance level of P<0.05. Data were presented as mean±standard error of the mean. (using “*” to indicate a statistical difference between ND and HF and “#” to indicate a statistical difference among the different types of activities: sedentary, swimming, swimming with a 50% load, or swimming with an 80% load).
RESULTS
Variation in body weight and adiposity
At the beginning of the experimental period, the body weights of all animals were similar for all individuals (average of 29.85 g); after the 16 weeks, all groups showed an increase in body weight (P<0.05, paired t-test). After the first eight weeks, animals that ingested the HFD showed a 20% increase in their body weight compared to animals fed the ND (Fig. 2A). After 8 weeks of swimming, the animals fed the HFD still showed greater weights. Among them, only the group that practiced swimming with an 80% load showed statistically similar weights to the ND 80% load (Fig. 2B, C).
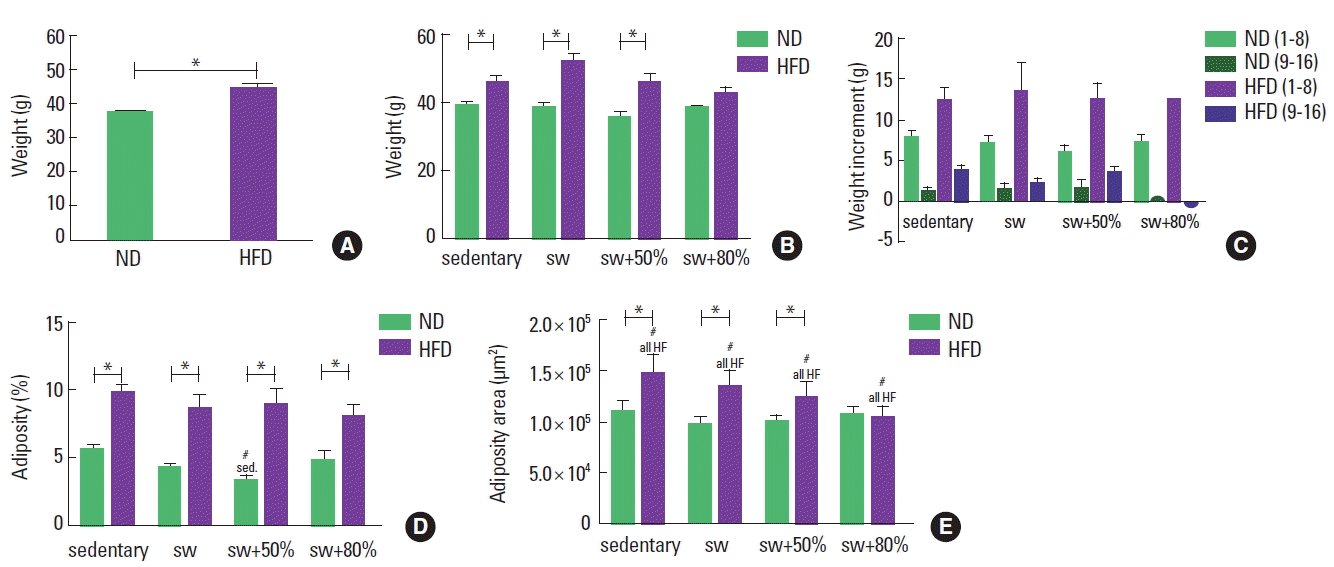
Body weight and adiposity. Normal diet (ND), high-fat diet (HFD), sedentary, swimming without load (sw), swimming with 50% of the maximum load (sw+50%), and swimming with 80% of the maximum load (sw+80%). (A) Weight after 8 weeks with different diets (g). (B) Weight at the end of the experiment. (C) Body weight increment during the experiment. (D) Adiposity (%, relation to body weight). (E) Area (μm2) of the adipocytes. Analysis of variance (ANOVA) one-way test with Bonferroni posttest was applied in panel A and ANOVA two-way test with Bonferroni posttest in panels B, D, and E, the Mann–Whitney U-test in panel C. *Significant statistical difference between the diet types. #Significant statistical difference among the activity types.
The HFD groups had a greater quantity of adipose tissue (almost 10% of the body weight) when compared to the ND groups, regardless of the activity performed (Fig. 2D). When swimming with a 50% load, the animals fed the ND showed a significant decrease in fat density in relation to the other groups fed the same diet. For the animals that consumed the HFD, exercise with a more intense load showed a trend of reduction in adipose tissue accumulation, but without a statistically significant difference among the groups. This trend may reflect the lowest area of adipocytes found in these animals, as shown in Fig. 2E. In addition, similar areas were identified among the ND and HFD animals that practiced swimming with an 80% load.
Caloric intake and glycaemia
The HFD animals consumed 28% (average) less (kcal) weekly than the animals that ingested the ND. This behavior was maintained during the periods before and after the introduction of exercise (Fig. 3A, B). During the 8 weeks of swimming training, the HFD with 80% load showed significant reduction in the caloric intake in comparison to sedentary animals (Fig. 3B).
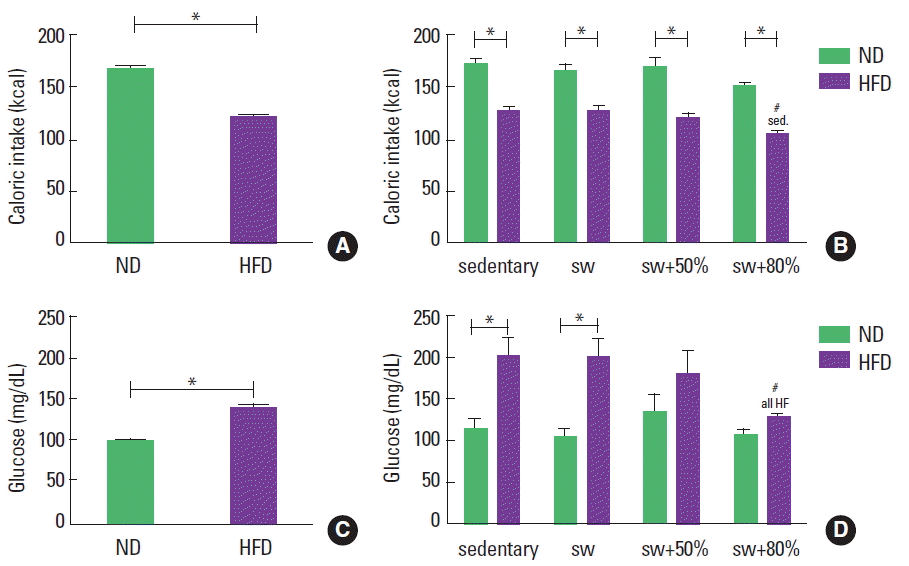
Caloric intake (kcal) and glycemic level (mg/dL of blood). Normal diet (ND), high-fat diet (HFD), sedentary (sed), swimming without load (sw), swimming with 50% of the maximum load (sw+50%), and swimming with 80% of the maximum load (sw+80%). (A) Caloric intake in the first 8 weeks. (B) Caloric intake in the last 8 weeks. (C) Glucose in the first 8 weeks. (D) Glucose in last 8 weeks. Analysis of variance test with Bonferroni posttest. *Significant statistical difference between the diet types. #Significant statistical difference among the activity types.
The initial glycemic level was around 100 mg/dL of blood for all animals. In sequence, after 8 weeks with different diets, the HFD induced a significant increase in the glycemic level by 38% compared to animals fed the ND (Fig. 3C). After 8 more weeks of diet and swimming, a reduction in the blood glucose level was observed only in the HFD group that practiced swimming with an 80% maximum load (Fig. 3D).
Progressive load test: maximum load and time of resistance
The progressive load test was used to update the weekly load during swimming training. The percentage of gain was calculated (final minus initial/initial×100) in relation to the load and to the time of resistance of the progressive test. By comparing the progression of the load supported by the animals and the time of resistance for all groups, an increment only in the time of resistance for both the ND and HFD groups was observed. By analyzing the maximum load reached (g), it was observed that the diet and the different intensities did not influence the load supported by the individuals throughout the experimental period (Fig. 4A). On the other hand, in relation to the entire time of resistance with the maximum load (sec), the sedentary animals fed the HFD swam for less time with the maximum load than those in the sedentary ND group. However, when swimming was practiced, the HFD animals achieved times of resistance similar to the ND animals (Fig. 4B).
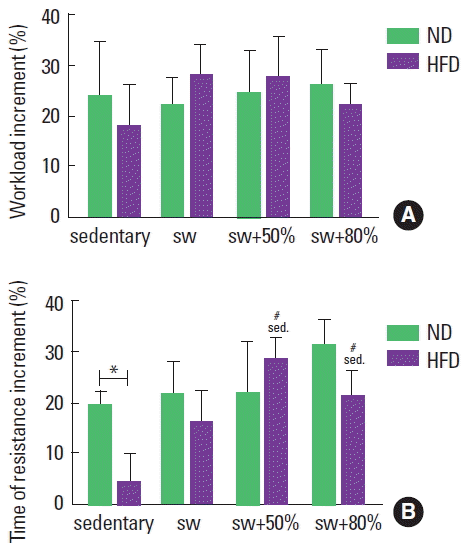
Progressive load test applied to groups: normal diet (ND), high-fat diet (HFD), sedentary (sed), swimming without load (sw), swimming with 50% of the maximum load (sw+50%), and swimming with 80% of the maximum load (sw+80%). (A) Increment of the load supported (%) after 8 weeks of training. (B) Increment of time of resistance supporting the maximum load (%) after 8 weeks of training. Mann–Whitney U-test. *Significant statistical difference between the diet types. #Significant statistical difference among the activity types.
Cross-sectional area of skeletal and cardiac fibers
A measurement of the cross-sectional area of fibers from the gastrocnemius muscle was performed to compare the influence of diet type and exercise on muscle hypertrophy. Animals that practiced swimming with an 80% load showed increments of 40% (ND) and 35% (HFD) in the cross-sectional area of the muscle cell (Fig. 5A).
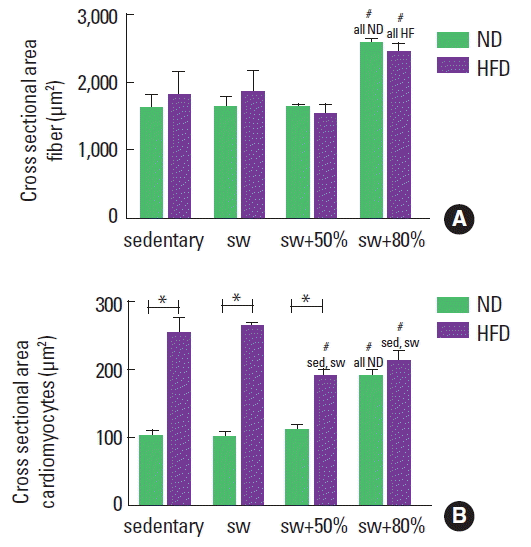
Area of skeletal muscle and cardiac fibers for the groups: normal diet (ND), high-fat diet (HFD), sedentary (sed), swimming without load (sw), swimming with 50% of the maximum load (sw+50%), and swimming with 80% of the maximum load (sw+80%). (A) Graph showing the area of the gastrocnemius muscle fibers. (B) Graph showing the area of ventricular fibers of myocardium. Analysis of variance test with Bonferroni posttest. *Significant statistical difference between the diet types. #Significant statistical difference among the activity types.
In the same way, the cardiomyocytes of all groups were measured. The consumption of HFD promotes cardiac hypertrophy and the practice of swimming was able to improve this condition. However, it was also observed that swimming with an 80% load induced an increase in the cross-sectional area of cardiomyocytes among ND animals in relation to others that consumed the same diet type.
DISCUSSION
Excessive caloric intake, despite the type of nutrient consumed, is a primary risk factor for the development of obesity (Cohen, 2008). However, a number of epidemiological studies have shown that population preferentially consuming diets rich in fat are especially prone to gain body mass (Antunes et al., 2015; Cesar and Pisani, 2017; Ogden et al., 2007). The results of this study show that after eight weeks, there was an increase in body weight among all animals, which was expected, since the animals used in the study were still in growth, and were purchased during their fifth week of life. However, the groups fed a greater quantity of fat presented a 20% greater increase in their body weight than those in the ND groups.
An interesting point about HFD animals is that they ate less in kcal (around 28%) than animals fed the ND. Contrary studies have shown a relationship between an HFD and hyperphagia (DiPatrizio, 2014; West and York, 1998; Westerterp et al., 2008). Our results reinforce the WHO data (World Health Organization, c2017a) that reports that the ingredients in a diet are more related to obesity than the energy quantity ingested.
To determine the adiposity in the animals, the adipose tissue was extracted and measured. The group that presented a smaller quantity of adipose tissue was the ND group that practiced swimming with 50% of the maximum load. In relation to the HFD animals, all showed around 50% more fat in relation to the ND animals. Among them, the animals fed the HFD and that practiced swimming with an 80% load showed a trend of body adiposity reduction, together with a significantly diminished area of adipocytes, which could explain the tendency observed in the Fig. 2D. Our results are contrary to those of Ropelle et al. (2010), who showed that the practice of chronic exercise with a similar protocol induces a significant reduction of fat in obese animals. However, we are in accordance with Kawanishi et al. (2010) and Kizaki et al. (2011). The first work showed that physical training did not induce a loss of adipose mass; however, positive effects were observed in relation to pro-inflammatory cytokines. The second demonstrated that voluntary exercise was capable only of attenuating the body mass gain.
The practice of swimming with 80% of the maximum load was efficient for maintaining weight, the quantity of food ingested, and the glycemic level. Another interesting aspect was that only an intensity of 80% of the maximum load achieved in the progressive test was efficient enough to promote training. Training adaptations were observed in relation to the time of resistance with the maximum load in the incremental test and in gastrocnemius and ventricular hypertrophy.
Regarding the maximum load supported by each group during the progressive test, it was observed that the animals that worked with an 80% load supported 6.1% and 5.9% of the body weights of the ND and HFD animals, respectively. Alternatively, animals in the sedentary, placebo, and swimming with a 50% load groups presented similar results, with an average of 4.2% and 4.1% of the body weights of the animals fed the ND and HFD, respectively. However, if only the maximum load (g) is considered, no significant difference was observed among all groups.
During the training sessions (1 hr for 5 days per week), the swimming with an 80% load group supported around 5% of its body weight, while the swimming with a 50% load group supported around 3% of its body weight for both diets. In accordance with Gobatto et al. (2009), loads above 4%–6% of the body weight of the swimmer mice represent the maximal lactate steady state, which in turn is considered the gold standard for the determination of the transition between aerobic and anaerobic metabolism. Moreover, it can be said that exercise practiced with 80% of the maximum load was more intense than with 50%. However, both remain at aerobic levels.
Although not enough results have been shown for weight and adiposity, it has been proven that many benefits are expected with the regular practice of physical activity. The positive effects of exercise of a mild to moderate intensity for individuals with type 2 diabetes, for example, culminate in insulin sensitivity improvement with a consequent reduction in the glycemic level (Ghiasi et al., 2016; Larsen et al., 2014). The results of this study indicate an increase of 38% in the glycemic level after eight weeks of a HFD. After the introduction of swimming, an increase in the glycemic level was still observed for individuals fed a HFD, except for animals that swam with an 80% load. Similarly, Connolly et al. (2016) showed that high-intensity swimming training is superior to low-intensity training in relation to insulin sensitivity and glucose control in inactive middle-aged women.
Saturated lipids are the main metabolic fuels for the heart. On the other hand, an excess of lipids may stimulate mitochondrial overwork and activate the molecular mechanisms of cardiac remodeling. The process of cardiac remodeling results in conditions of continuous aggression and have molecular, cellular, and interstitial repercussions that manifest clinically as changes in the size, geometry, and function of the heart (Lopaschuk et al., 2007). In this respect, a study has documented the occurrence of myocardial hypertrophy and interstitial fibrosis in different experimental models of obesity induced by diet (Martins et al., 2015). The results of this study point to cardiomyocyte hypertrophy of the left ventricle in the hearts of animals fed a HFD, possibly indicating the existence of arterial pressure overload (Fagard, 1997). Additionally, some metabolic diseases like dyslipidemia could produce an increase of sympathetic activity (Hall et al., 2015) which would also be partly responsible for the observed cardiac hypertrophy. In this case, the practice of swimming was able to reduce cardiac hypertrophy, showing that hemodynamic changes during the training sessions altered the conditions of cardiac overload.
An experimental study on treatment of obesity has some limitations when compared to human studies regarding the diversity of the diet of man and the pursuit of food in situations of lack of appetite, very present in our species. In addition, the practice of swimming is a very stressful situation for the animal, in this context, the sum of the stress effects added to the effect caused by the excess of lipids was not measured. Another point to be highlighted is that the volunteer activity was not taken into account in this work. Despite these limiting issues, studies with animals as experimental models allow the systematization and greater control of the offered diet and the quantity and quality of implementation of physical exercise, favoring the establishment of more homogeneous groups. This allows to study the impact of excessive fat ingestion in the quality of general health of animals as well as look at which swimming intensity is more recommended to alleviate the damage to health caused by a high fat diet.
Within this perspective, our study showed that the proportion of lipids between the macronutrients in the diet influence decisively the variables analyzed, and in this sense, the amount of fat in one’s diet must be reevaluated. Combined with healthy eating habits, the practice of moderate exercise produces benefits in relation to body constitution and other aspects that affect positively the general quality of life of an individual. By combining the results obtained in this study, the most effective responses in the treatment and prevention of obesity and its comorbidities were observed in animals that exercised with an 80 % load.
ACKNOWLEDGMENTS
This work had financial support from the Research Foundation of the State of Minas Gerais - Fapemig (process number: F4285) and from the National Council for Scientific and Technological Development - CNPq (process number: 473594/2011-0).
Notes
CONFLICT OF INTEREST
No potential conflict of interest relevant to this article was reported.