Relationship between cardiopulmonary responses and isokinetic moments: the optimal angular velocity for muscular endurance
Article information
Abstract
Most protocols for testing and rehabilitation for recovery and improvement of muscular endurance have been set at 180°/sec, 240°/sec, and 300°/sec. These protocols can cause confusion to clinical providers or other researchers. This study was aimed at investigating the optimal isokinetic angular speed for measuring or developing muscular endurance after assessing the relationship between cardiopulmonary responses and isokinetic moments. This study was conducted with 31 male and female college students. Graded exercise test and body composition were measured as well as the isokinetic moments of the knee muscles at three angular speeds: 180°/sec, 240°/sec, and 300°/sec. The specific isokinetic moments of knee muscles that were measured included: peak torque (PT) and total work (TW) on extensor (e) and flexor (f) of knee joints, which were denoted as ePT180, fPT180, eTW180, fTW180, ePT240, fPT240, eTW240, fTW240, ePT300, fPT300, eTW300, and fTW300 according to the three angular speeds. Spearman correlation test was used to examine the relationship between the sum means of cardiopulmonary responses and the variables of isokinetic moments. This study confirmed that the optimal angular speed for testing or training for muscular endurance was 180°/sec, which showed a stronger relationship between cardiopulmonary responses and isokinetic moments. Therefore, this angular speed is recommended for testing and training for muscular endurance of the knee joints.
INTRODUCTION
Engaging in vigorous physical activity often involves strong external forces, which can lead to injuries. Young college students in particular are more physically active compared to older individuals, but due to participating in games, activities, and exercises that involve much use of the lower limbs for quick and sudden changes in motion, knee joint related injuries occur most frequently in young people. In healthy individuals, most activities require only a fraction of maximal working capacity, measured by their cardiopulmonary capacity. However, in individuals with substantially reduced cardiopulmonary capacity as a result of injury, disease, or disability, the cardiopulmonary capacity required to perform daily activities may require a large percentage of maximal oxygen consumption, and may thus be a limiting factor for independence. Individuals facing these challenges may show greater fatigue and reduced endurance (Evans and Lambert, 2007).
Isokinetic dynamometry represents a widespread method for the assessment of muscle performance, both in research and clinical practice (Gleeson and Mercer, 1996). The assessment of muscle endurance with this kind of device is more recent and less documented (Bosquet et al., 2015). In fact, muscular joint function is divided into strength, power, and endurance. The goal of rehabilitation after surgical treatment of the knee joint is to restore muscular joint function. Although the postoperative muscle strength and recovery of muscular strength are important, the maintenance of muscle endurance that maintains the total muscular joint function is the first priority.
However, since most protocols for testing and rehabilitation for recovery and improvement of muscular endurance have been set at 180°/sec, 240°/sec, and 300°/sec, as recommended by many researchers (Appen and Duncan, 1986; Ghena et al., 1991; Schlinkman, 1984), these protocols can cause confusion to clinical providers or other new researchers. Some of these protocols have not been studied more specifically to muscular endurance development. In fact, the index of muscular endurance is very important to know the recovery process from injury or postoperative intervention. There also have been no studies regarding the relationship between various angular velocities from isokinetic protocols and the variables derived from the cardiopulmonary responses which are related to muscular endurance.
Therefore, this study investigated the correlation between the three angular velocities and the variables derived from the graded exercise test (GXT) for finding the isokinetic angular velocity suitable for optimal testing or training for muscular endurance.
MATERIALS AND METHODS
Participants
Thirty-one healthy and nonsmoking collegiate students (17 males and 14 females aged 20 to 25 years) of Hanseo University were the subjects for this study. In addition, to avoid the confounding effects of physical conditioning on cardiopulmonary capacity and muscular metabolism, participants who had not engaged in any specific physical activity in the preceding year were selected. The physical characteristics of the participants are shown in Table 1.
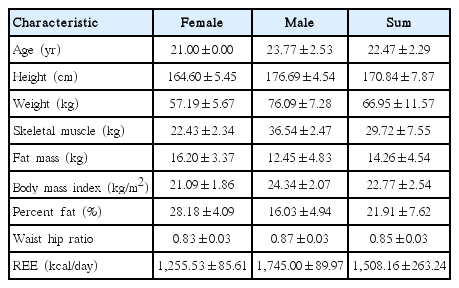
Physical characteristics of the subjects
Experimental design
All procedures were explained to the participants in detail prior to testing. All subjects signed an informed consent form that was approved by the Health Science Human Studies Committee of Hanseo University and Sahmyook University. Subsequently, the subjects later returned to the laboratory to complete the body composition assessments, GXT, and isokinetic tests for knee joints from September 23 to October 21, 2016. The testing procedure was administered to all of the participants by the same researcher. All tests were separated by at least 72 hr to ensure adequate time for recovery. To avoid any residual fatigue induced by recent workouts, participants were asked to refrain from strenuous exercise at least 48 hr before the tests (Bosquet et al., 2015).
Measurement methods
Body composition
Body composition measurements including body weight, skeletal muscle mass, body fat mass, body fat percentage, body mass index, and resting energy expenditure (REE) were taken by bioelectrical impedance analysis using InBody 230 (Biospace, Seoul, Korea), which is regarded as a simple, inexpensive, and reliable method for adult men and women (Janssen et al., 2002). BMS 330 anthropometer (BioSpace) was used to measure height. Body weight, muscle mass, and body fat mass are expressed in kg. Body fat percentage and REE are expressed in % and kcal/day, respectively. Analysis of body composition was measured before dinner and after voiding (Cha et al., 2014; Kim et al., 2015).
Isokinetic moment test
In this study, the HUMAC / NORM Testing & Rehabilitation System (CSMi, Stoughton, MA, USA) was used to analyze peak torque (PT) and total work (TW) of the knee extensor and flexor. All subjects were submitted to a stretching program and a warm-up program before the tests. The tested limb was placed and fixed with a Velcro strap on a support over the quadriceps and the knee joint was positioned at 90° flexion. Testing was performed in a seated position for knee extension/flexion rotators. The testing apparatus was set up and the subjects were positioned and stabilized uniformly. The subject’s leg was statically weighed to provide for gravity compensation of the test data. Testing was performed on the right side first and then performed on the left side. The range of motion for knee extension/flexion was from 0° to 90° (Kılınç et al., 2015). All of the subjects performed 4 maximal warm-up repetitions and 25 maximal real test repetitions at 180°/sec, 240°/sec, and 300°/sec, respectively. The resting time between each angular speed test was 1 day. All tests were supervised by one trained researcher. The measured results of isokinetic moments at three angular speeds were analyzed by PT and by TW on the right and left sides for all assessed knee joints. The right and left values of PT and TW were added together for the sum mean value and then expressed as mean±standard deviation.
Graded exercise test
In this study, the Cosmed Quark b2 (Cosmed, Albano Laziale, Rome, Italy) was used for measuring the cardiopulmonary responses of participants. The metabolic response variables, which included maximal oxygen uptake (MVO2) and REE, and the ventilator response variables, which included maximal ventilatory volume (MVE), maximal respiratory frequency (Mf ), and maximal ventilatory threshold (MVT), were measured at all-out stage. During the same test, maximal systolic blood pressure (MSBP), maximal diastolic blood pressure (MDBP), and maximal heart rate (MHR) were measured using Tango M2 (SunTech Medical, Morrisville, NC, USA).
Participants underwent a preliminary exercise test for 5 min at a speed of 3.0 mph and performed a maximal aerobic exercise test using the Bruce Protocol. It continued until the running speed could no longer be maintained (ratings of perceived exertion 20 or more, maximum heart rate steady state; respiratory exchange ratio [RER] 1.05 or more, steady state of oxygen intake), and the metabolic data was automatically recorded every 20 sec by gas. Respiratory variables measured during exercise testing included relative oxygen uptake (VO2: mL/kg/min) and RER. Thirty sec before the end of each exercise phase, participants were asked to express their physical feelings by hand to indicate the lightest state (1) to the hardest state (5).
Statistical analyses
Statistical analysis was conducted with IBM SPSS Statistics ver. 21.0 (IBM Co., Armonk, NY, USA). All data are reported as mean standard deviation. Descriptive analyses were performed on all variables and the Kolmogorov–Smirnov test was used to determine the normality of distribution for the examined variables. Since the data were not normally distributed, nonparametric Spearman correlation test was used to investigate the relationship between cardiopulmonary responses and isokinetic moments at 180°/sec, 240°/sec, and 300°/sec, respectively. We considered a correlation over 0.90 as very high, between 0.70 and 0.89 as high, between 0.50 and 0.69 as moderate, and under 0.49 as mild (Munro, 2005). In addition, for comparing the isokinetic PTs and TWs at 180°/sec, 240°/sec, and 300°/sec, we used the nonparametric Friedman test. The significance level for all analyses was set a priori at P<0.05.
RESULTS
Cardiopulmonary responses from GXT
The GXT was performed to determine the cardiopulmonary responses of participants and the results are shown in Table 2.
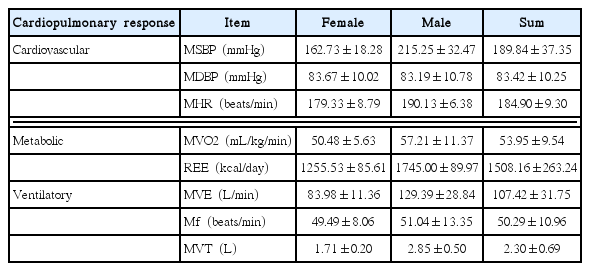
Results of cardiopulmonary responses through graded exercise test
Table 2 shows the sum mean values of male and female participants after GXT. Of cardiovascular responses, MSBP, MDBP, and MHR were 189.84±37.35 mmHg, 83.42±10.25 mmHg, and 184.90±9.30 beats/min, respectively. Of metabolic responses, MVO2 was 53.95±9.54 mL/kg/min and REE was 1508.16± 263.24 kcal/day. Of ventilatory responses, MVE, Mf, and MVT were 107.42±31.75 L/min, 50.29±10.96 beats/min, and 2.30± 0.69 L, respectively.
Results of isokinetic knee extension/flexion test at three angular speeds
The isokinetic test was performed to determine the muscular functions of the knee extensor and flexor of participants and the results are shown in Table 3.
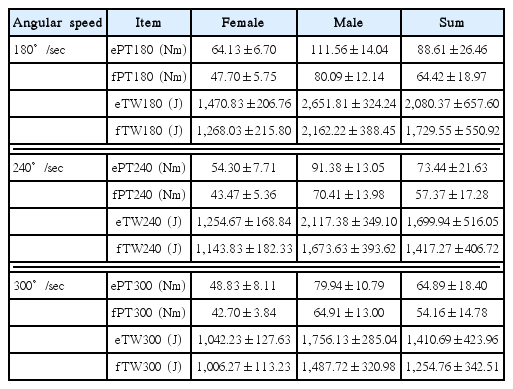
Results of isokinetic knee extensor/flexor at 180°/sec, 240°/sec, and 300°/sec
Table 3 shows the sum mean values of male and female participants after the isokinetic test. At 180°/sec, extensor PT (ePT180) was 88.61±26.46 Nm, the flexor PT (fPT180) was 64.42±18.97 Nm, extensor TW (eTW180) was 2080.37±657.60 J, and flexor TW (fTW180) was 1729.55±550.92 J. At 240°/sec, extensor PT (ePT240) was 73.44±21.63 Nm, flexor PT (fPT240) was 57.37± 17.28 Nm, extensor TW (eTW240) was 1,699.94±516.05 J, and flexor TW (fTW240) was 1,417.27±406.72 J. At 300°/sec, extensor PT (ePT300) was 64.89±18.40 Nm, flexor PT (fPT300) was 54.16±14.78 Nm, extensor TW (eTW300) was 1,410.69± 423.96 J, and flexor TW (fTW300) was 1,254.76±342.51 J. The results of all variables at 180°/sec were significantly higher than those of 240°/sec and 300°/sec (Figs. 1–4).

Comparison of isokinetic knee extensor peak torques at 180°/sec, 240°/sec, and 300°/sec. In the nonparametric Friedman test, there were significant differences among ePT180, ePT240, and ePT300. Moreover, the different value of ePT180 were higher than those of ePT240 and ePT300. Here, ePT180, fPT180, eTW180, fTW180, ePT240, fPT240, eTW240, fTW240, ePT300, fPT300, eTW300, and fTW300 mean extensor peak torque, flexor peak torque, extensor total work, and flexor total work at 180°/sec, 240°/sec, and 300°/sec, respectively. a, b, and c mean symbols of post hoc results.
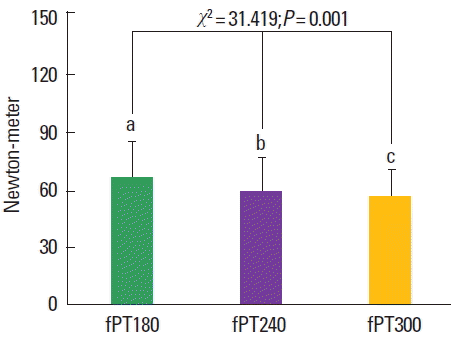
Comparison of isokinetic knee flexor peak torques at 180°/sec, 240°/sec, and 300°/sec. In the nonparametric Friedman test, there were significant differences among fPT180, fPT240, and fPT300. Moreover, the different value of fPT180 were higher than those of fPT240 and fPT300. Moreover, the different value of ePT180 were higher than those of ePT240 and ePT300. Here, ePT180, fPT180, eTW180, fTW180, ePT240, fPT240, eTW240, fTW240, ePT300, fPT300, eTW300, and fTW300 mean extensor peak torque, flexor peak torque, extensor total work, and flexor total work at 180°/sec, 240°/sec, and 300°/sec, respectively. a, b, and c mean symbols of post hoc results.
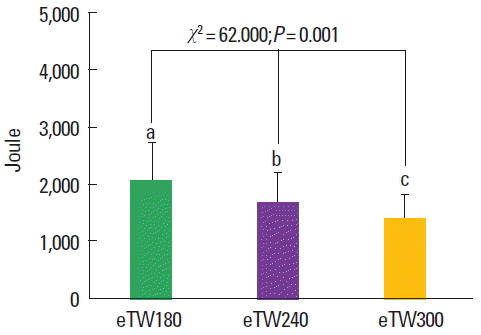
Comparison of isokinetic knee extensor total works at 180°/sec, 240°/sec, and 300°/sec. In the nonparametric Friedman test, there were significant differences among eTW180, eTW240, and eTW300. Moreover, the different value of eTW180 were higher than those of eTW240 and eTW300. Moreover, the different value of ePT180 were higher than those of ePT240 and ePT300. Here, ePT180, fPT180, eTW180, fTW180, ePT240, fPT240, eTW240, fTW240, ePT300, fPT300, eTW300, and fTW300 mean extensor peak torque, flexor peak torque, extensor total work, and flexor total work at 180°/sec, 240°/sec, and 300°/sec, respectively. a, b, and c mean symbols of post hoc results.
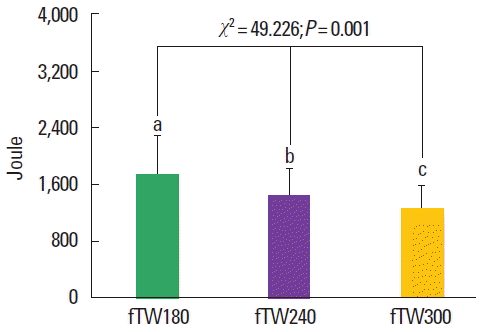
Comparison of isokinetic knee flexor total works at 180°/sec, 240°/sec, and 300°/sec. In the nonparametric Friedman test, there were significant differences among fTW180, fTW240, and fTW300. Moreover, the different value of fTW180 were higher than those of fTW240 and fTW300. Moreover, the different value of ePT180 were higher than those of ePT240 and ePT300. Here, ePT180, fPT180, eTW180, fTW180, ePT240, fPT240, eTW240, fTW240, ePT300, fPT300, eTW300, and fTW300 mean extensor peak torque, flexor peak torque, extensor total work, and flexor total work at 180°/sec, 240°/sec, and 300°/sec, respectively. a, b, and c mean symbols of post hoc results.
Correlation coefficients between variables of GXT and variables of isokinetic knee extension/flexion test at 180°/sec
Table 4 shows the results of correlation analysis between variables of GXT and variables of isokinetic test at 180°/sec.
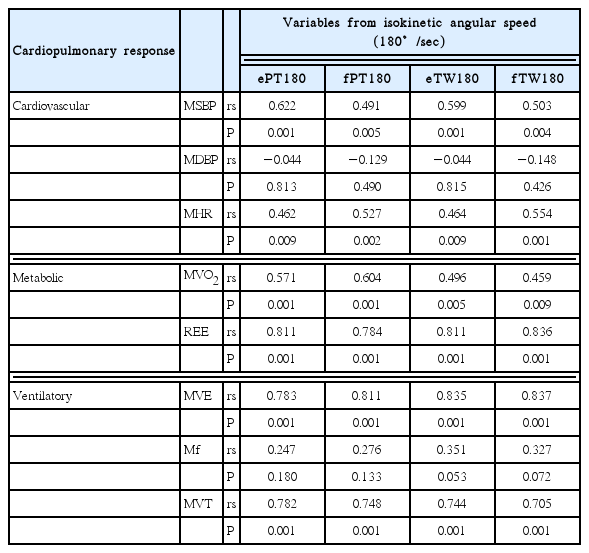
Correlation coefficients between sum means of cardiopulmonary responses and isokinetic knee extensor/flexor at 180°/sec
As shown in Table 4, MSBP of cardiovascular responses was significantly related to the overall ePT180, fPT180, eTW180, and fTW180, but not in MDBP. MHR of cardiovascular response was also significantly related to the overall PT and TW at 180°/sec. Of metabolic responses, MVO2 and REE was also significantly related to the overall PT s and TWs at 180°/sec. Of ventilatory responses, only MVE and MVT were significantly related to the overall PT and TW at same angular speed.
Correlation coefficients between variables of GXT and variables of isokinetic knee extension/flexion test at 240°/sec
Table 5 shows the results of the correlation analysis between variables of GXT and variables of isokinetic test at 240°/sec.
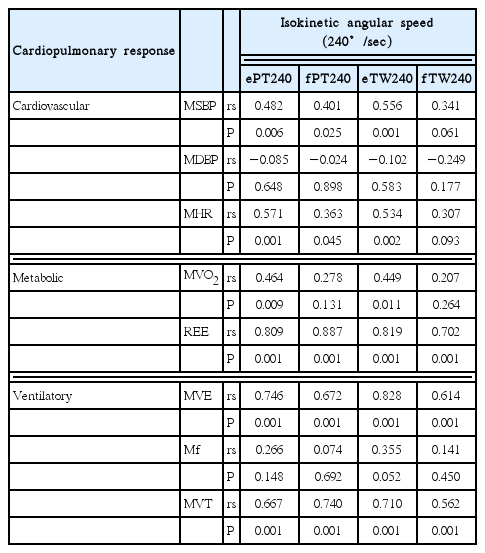
Correlation coefficients between sum means of cardiopulmonary responses and isokinetic knee extensor/flexor at 240°/sec
As shown in Table 5, MSBP and MHR of cardiovascular responses were significantly related to ePT240, fPT240, and eTW240, but not in fTW240. MDBP of cardiovascular responses was not significantly related to the overall values at 240°/sec. Of metabolic responses, MVO2 was significantly related to ePT240 and eTW240, but not in the flexor variables (fPT240 and fTW240). REE of metabolic responses was significantly related to the overall values at 240°/sec. These results were similar to MVE and MVT of ventilator responses.
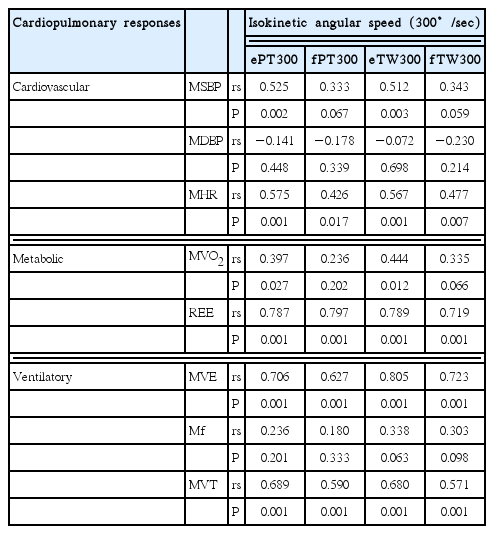
Correlation coefficients between variables of GXT and variables of isokinetic knee extension/flexion test at 300°/sec
Table 6 shows the results of correlation analysis between variables of GXT and variables of isokinetic test at 300°/sec.
Correlation coefficients between sum means of cardiopulmonary responses and isokinetic knee extensor / flexor at 300°/sec
As shown in Table 6, MSBP of cardiovascular responses was significantly related to ePT300 and eTW300, but not in fPT300 and fTW300. MDBP of cardiovascular responses was not significantly related to the overall values at 300°/sec. Of metabolic responses, MVO2 was significantly related to ePT300 and eTW 300, but not in the flexor variables (fPT300 and fTW300). REE of metabolic responses was significantly related to the overall values at 300°/sec. These results were similar to MVE and MVT of ventilator responses.
DISCUSSION
The purpose of this study was to find the optimal angular speed (180°/sec, 240°/sec, or 300°/sec) for muscular endurance tests or rehabilitation through assessing the relationship between the variables of isokinetic tests (ePT, fPT, eTW, and fTW) and the variables of GXT (cardiovascular, metabolic, and ventilatory) to determine the most effective test methods.
In the results of this study, the overall ePT, fPT, eTW, and fTW at 180°/sec were significantly higher compared to those at 240°/sec and 300°/sec. Moreover, this study found that peak moment and TW at isokinetic 180°/sec were moderately to highly correlated with the variables derived from GXT which were associated with muscular endurance. These results suggest that resistance in the lower extremity is related to the cardiopulmonary responses.
In the past, Astrand and Rodahi (1977) reported that the steady-state VO2 measurement and cycle ergometer work rate in the lower extremity were commonly used interchangeably when describing the level of exercise being performed. It appears that the cardiopulmonary responses involving cardiovascular, metabolic, and ventilatory factors were somewhat related to the muscular moments obtained from the specific muscle tests. Wasserman et al. (1987) also reported that any trained or untrained individuals, whether old or young, male or female, all have similar work capacities reflecting the biochemical energy yielding reactions to achieve muscle contraction (Wasserman and Whipp, 1975; Whipp and Wasserman, 1969).
Meanwhile, we found that the cardiovascular, metabolic, and ventilatory responses in the GXT were highly associated with the overall peak moment and TW of the lower extremities at 180°/sec compared to those at 240°/sec and 300°/sec. These results suggest this angular speed of 180°/sec used from an isokinetic machine well represents the variables derived from GXT. In other words, it can provide suitable resistance for measuring muscular endurance in the legs while not using any extremely low angular speeds, such as under 60°/sec. Dvir (2004) reported that the use of very low velocities was contraindicated in ligamentous or patellofemoral disorders, unless the purpose of the test was the provocation of a specific reaction like a ‘break’ or weak point in the moment curve. He also reported that a reasonable and comfortable range for test angular velocities is between 60°/sec and 180°/sec. It also seems to meet the essential requirement of test validity and the need for information about muscle performance at the functional range. However, since there are many protocols for muscular endurance tests and rehabilitation training such as 180°/sec, 240°/sec, and 300°/sec, researchers may not know the most effective one to use. In addition, some of these protocols have not been specifically studied to determine the best angular speed for muscular endurance development which are related to cardiopulmonary responses.
Thus, this study investigated the correlation between peak moment and TW at three angular velocities and the variables derived from GXT which were associated with muscular endurance. Specifically, the results of this study showed that MSBP (rs=0.491–0.622) and MHR (rs=0.462–0.554) of cardiovascular responses were mildly to moderately associated with the isokinetic results at 180°/sec, respectively. The MVO2 of metabolic responses was mildly to moderately associated with the isokinetic results at 180°/sec (rs=0.459–0.604), however, the REE of metabolic responses was highly associated with the isokinetic results at 180°/sec (rs=0.784–0.836). The MVE (rs=0.783–0.837) and MVT (rs=0.705–0.782) of ventilatory responses was highly associated with the isokinetic results at 180°/sec, respectively. However, the peak moments and TWs derived at 240°/sec and from 300°/sec showed a mild to moderate relationship among cardiovascular, metabolic, and ventilatory responses in the GXT. Some of these related values were not significant and most of these correlation values were not as high as those at 180°/sec. Specifically, the cardiovascular responses were mildly to moderately associated with the isokinetic results at 240°/sec (MSBP, rs=0.401–0.556; MHR, rs=0.363–0.571) and at 300°/sec (MSBP, rs=0.512–0.525; MHR, rs=0.426–0.575). The metabolic responses were also mildly to moderately associated with the isokinetic results at 240°/sec (MVO2, rs=0.449–0.464; REE, rs=0.702–0.887) and at 300°/sec (MVO2, rs=0.397–0.444; REE, rs=0.719–0.797). Finally, the ventilatory responses were moderately to highly associated with the isokinetic results at 240°/sec (MVE, rs=0.614–0.828; MVT, rs=0.562–0.740) and at 300°/sec (MVE, rs=0.627–0.805; MVT, rs=0.571–0.689). It should be recognized that the muscular endurance test using an isokinetic machine at 180°/sec was a better method compared to 240°/sec and 300°/sec, which were in line with the results from Dandurand et al. (1995) and Taivassalo et al. (2003). Considering that aerobic contribution to energy expenditure increases exponentially from the first seconds of exercise and represents the main metabolic pathway beyond maximal exercise (Gastin, 2001), it is quite legitimate to question the exact physiological meaning of measures obtained at isokinetic 180°/sec.
In view of the growing interest in using high velocity knee testing and rehabilitation, Hall and Roofner (1991) offers original information and a practical approach to determining individual performance. The authors used a sample of 60 normal subjects (30 female; 30 male subjects) of 20–62 years of age, and velocities of 60°/sec, 180°/sec, 300°/sec, 400°/sec, and 500°/sec. The measured parameters included quadriceps peak moment, average work, and power. It was suggested that at 180°/sec, these factors may account for 80%, 74%, and 51% of the differences in quadriceps strength, average work, and average power, respectively. These results were similar to our results. In other words, our data showing a strong relationship between peak moment and TW at 180°/sec and cardiopulmonary capacities suggest that these relationships can be linked. Therefore, heightened cardiopulmonary responses could be expected at 180°/sec in which muscular endurance was more pronounced. Our data, therefore, indicated that testing and rehabilitating the knee joints at 180°/sec may be the ideal angular velocity for functional muscular endurance in healthy populations. Selecting a more effective angular velocity can contribute to the success of rehabilitation and produce more accurate test results.
ACKNOWLEDGMENTS
The authors wish to thank the participants who volunteered their time to contribute to this research project. This research was supported by a grant in 2016 from Hanseo University, Republic of Korea.
Notes
CONFLICT OF INTEREST
No potential conflict of interest relevant to this article was reported.