Diabetes reduces the cognitive function with the decrease of the visual perception and visual motor integration in male older adults
Article information
Abstract
This study investigated the influence of diabetes on cognitive decline between the diabetes and non- diabetes patients and identified the associations between diabetes and cognitive function, visual perception (VP), and visual motor integration (VMI). Sixty elderly men (67.10± 1.65 yr) with and without diabetes (n= 30 in each group) who were surveyed by interview and questionnaire in South Korea were enrolled in this study. The score of Mini-Mental State Examination of Korean version (MMSE-KC), Motor-free Visual Perception Test-Vertical Format (MVPT-V), and Visual-Motor Integration 3rd Revision (VMI-3R) were assessed in all of the participants to evaluate cognitive function, VP, and VMI in each. The score of MMSE-KC in the diabetic group was significantly lower than that of the non-diabetes group (P< 0.01). Participants in the diabetes group also had lower MVPT-V and VMI-3R scores than those in the non-diabetes group (P< 0.01, respectively). Especially, the scores of figure-ground and visual memory among the subcategories of MVPT-V were significantly lower in the diabetes group than in the non-diabetes group (P< 0.01). These findings indicate that the decline in cognitive function in individuals with diabetes may be greater than that in non-diabetics. In addition, the cognitive decline in older adults with diabetes might be associated with the decrease of VP and VMI. In conclusion, we propose that VP and VMI will be helpful to monitor the change of cognitive function in older adults with diabetes as part of the routine management of diabetes-induced cognitive declines.
INTRODUCTION
Cognitive decline with aging is generally associated with a variety of factors. Older adults have reduced brain tissue volume, decreased levels of sex hormones, and diminished memory, attention, and executive function as well as increased risk of comorbid metabolic syndrome such as diabetes mellitus (DM), hypertension, dyslipidemia, and abdominal obesity which is related to cognitive decline with age (Myers, 2008).
Of these, DM may be concerned as a main factor of inducing cognitive decline in older adults. DM including hyperglycemia lead to atrophy, mainly in the frontal and temporal regions, causing cognition impairment and imbalance (Last et al., 2007) and induced cognitive dysfunction directly or via vascular diseases in older adults (Dik et al., 2007). Another study also reported that concern about DM as a significant risk factor for cognitive impairment and substantial cognitive decline in older adults has been increasing (Okereke et al., 2008). In recent survey, the prevalence of DM increases with age, from 9.7 to 19.7% and then 25% among individuals older than 30, 65, and 70 yr, respectively in Korea (Korea Centers for Disease Control and Prevention, 2011). This means that it might be necessary to study the relevance between DM and cognitive function in older adults at this time in Korea.
Individuals with cognitive deficits have simultaneous perceptual problems. A positive relationship between visual perception and cognitive function, and between motor praxis and visual perception has been demonstrated (Kim et al., 2006; Lee, 2011). Also, cognitive and perceptual ability was identified as a determinant factor of functional performance (Brown et al., 2013). Perceptual deficits make organizing, processing, and interpreting visual-motor stimuli and action difficult (Mercier et al., 2001). Thus, older diabetic adults with cognitive impairments may have a high risk of functional disability. In fact, they have a higher incidence rate of falls and poor balance skills than non-diabetic older adults (Munshi et al., 2006). According to a systematic review describing cognitive decline in diabetes, the Mini-Mental State Examination (MMSE) is one of the most frequently used tests for assessing cognitive function, and diabetic participants had 1.2 to 1.5 fold greater cognitive decline than non-diabetic participants (Cukierman et al., 2005). The MMSE evaluates the cognitive parameters of orientation to time and place, memory, attention, calculation, language function, understanding, judgment, and visuospatial construction. Of them, Brown et al. (2010) have proposed that visuospatial ability is the best predictor of functional dependence in activities of daily living in a geriatric evaluation unit. Visual perception (VP) is closely related to cognitive function in the elderly (Lee, 2011) and then should be evaluated to assess cognitive function and its direct influence on activities of daily living.
VP can be evaluated by the Motor-free Visual Perception Test-Vertical Format (MVPT-V), which consists of 5 categories: visual discrimination, figure-ground differentiation, visual memory, visual closure, and spatial relationships (Brown et al., 2010). Visual discrimination and synthesis allow individuals to perceive detailed characteristics and integrate them into a whole. Figure-ground differentiation allows individuals to distinguish the foreground from the background. Visual memory assists in immediate recall, and form constancy, which is related to visual closure and spatial relationships, is the ability to identify a part of a whole despite variations in form or space (Mercier et al., 2001).
Visual-motor integration (VMI), which is related to executive function in activities of daily living, is also a component of cognitive deficit assessment and measures perceptual motor skills and the degree to which limb movement is coordinated with visual perception (Brown et al., 2010). As noted, it is reported that diabetes is closely associated with cognitive impairment (Dik et al., 2007; Okereke et al., 2008; Roberts et al., 2008), and it was recently demonstrated that visual motor integration may be associated with diabetes in male older adults (Yun et al., 2011). However, few studies have examined the relationship between diabetes and visual perception and/or visual motor integration in male older adults, and as yet, there is no definitive proof that diabetes has a more detrimental impact on cognition than non-diabetes in older adults.
Here, we investigated the influence of diabetes on cognitive function, visual perception, and visual motor integration in between diabetes and non-diabetes of an older adult male South Korean population selected from a metropolitan veterans’ hospital.
MATERIALS AND METHODS
Study design and participants
This was a cross-sectional and descriptive study based on data collected by questionnaires and face-to-face interviews. Participants were recruited from an urban veteran’s hospital in South Korea. A minimum of 22 participants per group was required for effect size of 0.40 and an alpha of 0.05 (two-tailed) with a power of 0.8 by analysis using G-Power 3.1. We initially recruited 80 volunteers in consideration of possible dropouts. Study inclusion criteria were 1) male gender; 2) age 65 to 70 yr; 3) consent to participate in the study; 4) normal ability of communication and understanding; 5) not known to have psychological illness or to take any psychiatric medications; 6) without known functional impairment due to hearing and vision loss; 7) Korean. Ultimately, a total of 60 older adult males with and without diabetes (n=30 in each group) were enrolled in this study. The length of time that the participants had diabetes was at least over 5 yr. Older females were not included because the changes of blood levels of sex hormones with aging can be another considerable factor for cognitive decline. The participants were divided into 2 groups: the diabetes group and the non-diabetes group.
Ethical considerations
For the ethical protection of the participants, this study was conducted with the approval of the institutional review board of the hospital (Approval No. N2010-2). Each participant signed a written consent after receiving information about the study goals, data collection, and confidentiality. They were told that the data collection process could be stopped at any time with no penalty.
MMSE-KC test
Cognitive function was measured by the validated Korean version (KC) of MMSE of the Consortium to Establish a Registry for Alzheimer’s Disease (CERAD) assessment packet (Lee et al., 2002). The MMSE-KC was modified based on the socio-cultural and language characteristics of the Korean elderly population. The MMSE-KC is made up of 8 sections that generate a score ranging from 0 to 30, with a higher score indicating better cognition and a score less than 24 indicating abnormal cognitive function. This scale evaluates the following areas of cognition: Time orientation (5 points), Place orientation (5 points), Memory registration (3 points), Attention and calculation (5 points), Memory recall (5 points), Language function (4 points), Visio-spatial construction (2 points), Understanding and judgment (1 point). Total score in each participant was used for data analysis.
MVPT-V test
The MVPT-V was used to evaluate the visual perception of the participants. Originally, the MVPT was designed as a concise evaluation of visual perception in young children. Later, Eimon et al. (1983) adapted it for adults and the elderly. This assessment instrument provides information regarding overall performance that can yield information about an individual’s functional abilities in each visual field. The MVPT-V is a 36-item individually administered, multiple-choice test of visual perception that generates a score ranging from 0 to 36. A higher score indicates better visual perception. The test is divided into 5 sections, as follows: Visual discrimination (VD, 8 items), Figure-ground (FG, 5 items), Visual Memory (VM, 8 items), Visual closure (VC, 11 items), Spatial relationship (SR, 4 items). Each section begins with a specific instruction and an example trial in order to ensure that the participant understands the instruction of each section. Testing lasted approximately 7 to 20 min according to the participant’s abilities. Total score in each participant was used for data analysis.
VMI-3R test
The VMI-3R was used to evaluate the ability of visual-motor integration in the participants. The visual-motor integration test assesses the extent to which individuals can integrate their visual and motor abilities and then involve the coordination of visual perceptual skills and finger-hand movements. This test contains a sequence of 24 geometric forms of increasing complexity, ranging from a simple vertical line to a complex three-dimensional star. Participants are asked to copy each item as accurately as they can and the test was stopped when a participant made more than 2 errors in a row. The VMI scores were standardized for age and gender using normative data for the general population (Beery and Beery, 2004). Higher score indicated better visual-motor integration. In this study, the visual motor integration was assessed using VMI-3R, which is modified by the Beery-Buktenica Developmental test of the Visual-Motor Integration (Beery, 1997). The VMI-3R score were expended total 50 points from 24 point in order to assign weight for each item. Total score in each participant was used for data analysis.
Statistical analysis
The data were analyzed with the SPSS software package for Windows version 12.0 (SPSS Inc., Chicago, IL, USA). Normally physiological characteristics and results were expressed as mean ± standard deviation (SD). An independent t-test was used to identify possible differences in scores of the MMSE-KC, the MVPT-V, and the VMI-3R between two groups. The level of statistical significance was set at P<0.05.
RESULTS
Demographic characteristics of the participants
The study sample comprised 60 participants, representing an approximately normal distribution of all the variables such as age, height, weight, and body mass index. There were no significant differences with respect to any variable between the non-diabetes group and diabetes group. The physiological characteristics of the elderly male participants are presented in Table 1.
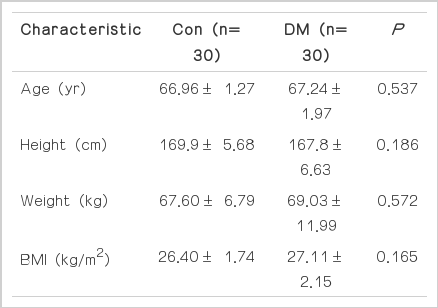
Physiological characteristics of male elderly in each group (Mean± SD)
Effect of diabetes on cognitive function measured by the MMSE-KC
The mean MMSE-KC scores are presented in Fig. 1. The mean scores in the non-diabetes and diabetes groups were 29.46±1.22 and 27.56±2.45, respectively (t=3.78, P<0.01). This result indicates that the diabetes impairs cognitive function in male older adults.

Effect of diabetes on cognitive function measured by the MMSE-KC in elderly men. The data are expressed as mean± SD. *P< 0.05 compared with the non-diabetes group. CON, control group; DM, diabetes group.
Effect of diabetes on visual perception measured by the MVPT-V
The mean scores and times in the MVPT-V are presented in Fig. 2. The mean total scores in the non-diabetes and diabetes group were 31.96±2.91 and 28.13±4.21, respectively (t=4.09, P<0.01).
Effect of diabetes on visual perception measured by the MVPT-V in the elderly men. (A) Mean total scores of the MVPT-V. (B) mean testing times. (C) mean sectional scores. The data are expressed as mean± SD. *P< 0.05 compared with the non-diabetes group. CON, control group; DM, diabetes group; VD, visual discrimination; FG, figure-ground; VM, visual memory; VC, visual closure; SR, spatial relationship.
In 5 sections of the MVPT-V, the mean scores in the non-diabetes group and the diabetes group were respectively as follows: visual discrimination, 4.53±0.62 and 4.06±0.78; figure-ground, 7.83±0.59 and 6.50±0.33; visual memory, 7.26±1.20 and 6.13 ±1.27; visual closure, 8.43±2.06 and 7.66±2.30; spatial relationship, 3.90±0.40 and 3.66±0.84. Diabetes group had statistically lower mean scores in the figure-ground (t=5.01, P<0.01) and visual memory (t=3.53, P=0.01) categories than the non-diabetes group; meanwhile, there were no statistically significant differences with respect to visual discrimination (t=2.54, P=0.14), visual closure (t=1.35, P=0.18) and spatial relationship (t=1.36, P=0.17) between two groups.
The mean times in the MVPT-V for the non-diabetes and diabetes groups were 8.60±1.77/min and 28.13±4.21/min, respectively. Diabetes group required significantly more testing time to finish the MVPT-V than the non-diabetes group (t=−4.06, P< 0.01). These results show that the diabetes impairs visual perception, especially with respect to figure-ground and visual memory but not visual discrimination, visual closure and spatial relationship in male older adults. Thus, male older adults with diabetes required more time to finish the MVPT-V than those without diabetes.
Effect of diabetes on visual-motor integration measured by VMI-3R
The mean score and numbers of correct and incorrect answers on the VMI-3R are presented in Fig. 3. The mean scores in the non-diabetes and diabetes group were 39.83±8.40 and 31.06±11.11, respectively (t=3.44, P=0.01).
Effect of diabetes on VMI measured by the VMI-3R in the elderly men. (A) Mean scores in the VMI-3R. (B) mean numbers of correct answers. (C) mean numbers of errors. The data are expressed as mean± SD. *P< 0.05 compared with the non-diabetes group. CON, control group; DM, diabetes group.
The mean numbers of correct answers in the non-diabetes and diabetes group were 20.80±2.72 and 17.80±3.80, respectively (t=3.51, P=0.01); the mean number of errors in the non-diabetes and diabetes group were 3.20±2.72 and 6.20±3.80, respectively (t=−3.51, P=0.01). These results show that the diabetes impairs visual-motor integration in male older adults.
DISCUSSION
This study investigated the influence of diabetes on cognitive decline between the diabetes and non- diabetes patients and identified the associations between diabetes and cognitive function, visual perception, and visual motor integration. In this study, male older adults with diabetes had significantly lower MMSE-KC scores than non-diabetes group, indicating lower cognitive function in relation to orientation for time and place, memory, attention, calculation, language function, and visuospatial construction. In a similar study, however, there was no statistically significant difference in cognitive function assessed by the MMSE between diabetes and non-diabetes patients (Choi et al., 2002). In the present study, the finding is considered to be influenced by study design to control gender as male and 65 to 70 yr old in 30 subjects each with diabetes and non-diabetes. Otherwise, the study of Choi et al. (2002) included female, male, all age groups of 65 or more in a small sample which included 20 each of diabetics and non-diabetes. Other studies have reported that older adults with diabetes showed cognitive deficits at the MMSE scores (Alencar et al., 2010; Ravonoa-Springer et al., 2010; Yamazaki et al., 2011). The present study is concordant with those of these studies. Thus, it suggests that diabetes may be associated with accelerating cognitive decline in older adults.
In this study, the MVPT-V scores of the older adults with diabetes were significantly lower than those of the non-diabetes group. Although there was no statistically significant difference in the visual discrimination, visual closure, and spatial relationship scores among the 5 subcategories of the MVPT-V, the figure-ground and visual memory scores were significantly lower in the older adults with diabetes than the non-diabetes group. The figure-ground is the ability to distinguish an object from its background. The visual memory is the ability to recall dominant features of one stimulus item or to remember the sequence of several items. In the present study, the diabetes group had low the figure-ground and visual memory scores, suggesting the importance of the changes in ability of the older adults with diabetes to perform activities of daily living.
In addition, the older adults with diabetes required more time to complete the MVPT-V than those without diabetes. Previous studies have shown that the MVPT may be useful for screening for visual perceptual deficits and differentiating between normal aging and pathological change of visual perception (Eimon et al., 1983; Mercier et al., 2001). Meanwhile, visual perception assessed by the MVPT is reported to be an important factor in the recovery of cognitive function in patients who have had a stroke because visual perceptual training improves the MVPT and/or MMSE scores in stroke patients (Kim et al., 2010; Lee and Lee, 2009). A recent study also demonstrated a significant correlation between cognitive function and visual perception in older adults (Lee, 2011). Together with the results of previous studies, the present study results suggest that the decline in cognitive function in older adults with diabetes may be in part due to decreased visual perception including decreased figure-ground and VM abilities. Thus, decrease in spatial perception or loss in temporal memory due to diabetes can lead to inconveniences in the patients’ daily lives, including physical activity.
The influence by diabetes on visual motor integration in the older adults in this study is very surprising. To our knowledge, no other studies to date have reported the relationship between diabetes and visual motor integration in older adults. Most visual motor integration research has been conducted on brain abnormalities in children. A few studies suggest that visual motor integration is easily affected by various factors such as intelligence, auditory ability, linguistic experience, and various brain anomalies (Horn et al., 2007; Okkerse et al., 2005). A recent study revealed that handwriting difficulties in Chinese children are partly associated with reduced visual motor integration ability (Poon et al., 2010). Furthermore, another study reported that visual motor integration tests are applicable to adults and the elderly (Brown et al., 2010). More recently, we suggested that diabetes diminishes visual motor integration ability in older male adults (Yun et al., 2011), which is supported by the present results. Together with previous studies, the present study findings suggest that visual motor integration dysfunction is closely related to the diabetes-induced cognitive decline in older adults. Visual-motor integration, which is related to executive difficulties in activities of daily living in older adults, measures the degree to which limb movement is coordinated with visual perception (Brown et al., 2010). Thus, the impairment of visual motor integration in older adults with diabetes leads to them having poor balance skills and a higher incidence rate of falls and accidents (Brown et al., 2010). These results suggest that diabetes might lead to a discord between visuo-spatial and motor information, resulting in dangerous outcomes such as falls.
In sum, this study demonstrated that diabetes might be a factor to decrease cognitive function and not only cognitive function but also visual perception and visual motor integration could be observable behavioral markers to detect cognitive decline in older adults. Even though older adults want to perform functional activities to maintain independency, many factors deteriorates visual perception and visual motor integration as well as cognitive function and it leads to decrease functional ability, independence, and up to quality of life. Thus, health care providers for older adults have to be sensitive to change of many kinds of factors related to cognitive processes. Based on this study, we propose that visual perception and visual motor integration will be helpful to monitor the change of cognitive function in older adults with diabetes as part of the routine management of diabetes-induced cognitive declines.
There are a few limitations of the current study. First, major limitation is that there were no criteria on the normal level of visual perception and visual motor integration for older adults. For this reason, the present neuropsychological results did not explain directly whether the decreased level of cognitive function including visual perception and visual motor integration by diabetes is meaningful or not in the clinical setting. It is required to examine and make age-dependent normal range of visual perception and visual motor integration for normal older adults. Second, the inadequate groups were one of the limitations to get further conclusions because there was no previous research on visual perception and visual motor integration for older adults. It was desirable to use three groups including other disease to make our result more clear.
Notes
CONFLICT OF INTEREST
No potential conflict of interest relevant to this article was reported.
Acknowledgements
This work was supported by the National Research Foundation of Korea Grant funded by the Korean Government (NRF-2012 S1A5B6034110).