Analysis on leisure patterns of the pre-elderly adults
Article information
Abstract
The purpose of study is to analyze how leisure activities affect the near elders’ preparation for successful and productive aging. To achieve the purpose of the study, this study was conducted in 2012 and the data was collected by using multi-stage stratified cluster random sampling method in the great city area (6 places), metropolitan area (7 places), medium-sized urban area (6 places), and rural area (6 places). Out of the total number of 1,000 copies of questionnaire distributed to pre-elders (Baby-boomers from 55 yr to 64 yr), 978 were collected and used for data analysis. According to the result, the more time, frequency and intensity in leisure and recreational participation, the higher the satisfaction level and the happiness level in their life. It means that leisure and recreational activities play an important role for their life. In other words, for pre-elders, leisure activities can be regarded as the important element for preparation of their old age. Therefore, the leisure and recreation for pre-elderly adults should not be recognized as a tool for improving the economic productivity but for reinforcing the recovery resilience.
INTRODUCTION
The rapid increase in the number of elderly population demands for a new policy for the elders. The most important reason is related to the continued extension of life span in humans through the development of medical technologies. Life has been extended but what about their life? Despite the fact that they have played an important role in the development of society, inevitably, they have also faced challenges such as loneliness, isolation, economic hardship, and cut off from the society. This phenomenon can apply to almost all the elders.
Although pre elderly adults’ generation is not elderly generation of seniors, they have a similar experience through the businesses early retirement and early mandatory retirement programs. They can be defined as the generation baby boomers, who were born from 1955 to 1963, in which all of them will reach age 65+ based on year 2020 (Yi et al., 2010).
Among the elders, the meanings of happy life of elders are often mentioned in “successful aging” concept. Since the 1980s, the development of medical technology and health care access has been both changed their lifestyle and or led to “Successful aging” (Estes et al., 2001). The meaning of successful aging provides an opportunity for appropriate level of social behavior and as a result, this offers appropriate direction to the aging process. However, under neoliberal economic policy, socio-economic condition such as reduction of country’s welfare budget causes a paradigm shift in successful aging for elders and the introduction of new policy leads to the creation of a new paradigm of productive aging.
The discourse on productive aging was caused by an unequal distribution of welfare between the generations in the field of public policy areas in the United States in the late 80s and the main argument was to refute the negative bias regarding that the elders are monopolizing social resources (Estes et al., 2003). Therefore, the definition of productive aging in the argument refers to the elders who are contributing to the production activities such as production of goods or services whether received pay of unpaid or, develop abilities to produces goods and services (Bass and Care, 2001; Care et al., 1993). According to the above concept definition, the production activities can only be quantified in the form of economic value. Thus, whether the activities of elders are productive activities or non-productive activities is determined by the fact that their actions produce economic values to themselves or society (Chung et al., 2009).
As illustrated, productive aging is a new paradigm for elders who live in an era of rapid change. Therefore, the pre-elderly adults who will become elders in the near future need the recreational leisure activities for integrated rehabilitation and productivity improvement as the elders are physically, mentally and socially exhausted throughout their lives. The government has established a national level of welfare system and used leisure and recreation programs to relieve social dysfunction which is brought about by the increase in the number of the elderly population (Heitmann, 1984; Riddick, 1985; Riddick and Daniel, 1984; Stock et al., 1983; Wenzel et al., 2002). In other words, providing a variety of leisure and recreational activities programs to elders, the government tries to prevent early signs of diseases that appears to the elders such as depression and isolation predictive factors causing anti-social behavior.
Therefore, the purpose of this study is to investigate how the recreational leisure activities affect the pre elderly adults’ preparation for successful and productive aging. It would provide a better understanding of the meaning leisure activities and valuable information for the future study on pre-elderly adults.
MATERIALS AND METHODS
Participants
The study was conducted in 2012 and the data was collected by using multi-stage stratified cluster random sampling method in the great city area (6 places), metropolitan area (7 places), medium-sized urban area (6 places), and rural area (6 places). Out of the total number of 1,000 copies of questionnaire distributed to pre-elders (Baby-boomers from 55 yr to 64 yr), 978 were collected and used by data analysis. The characteristics of subject are presented in Table 1.
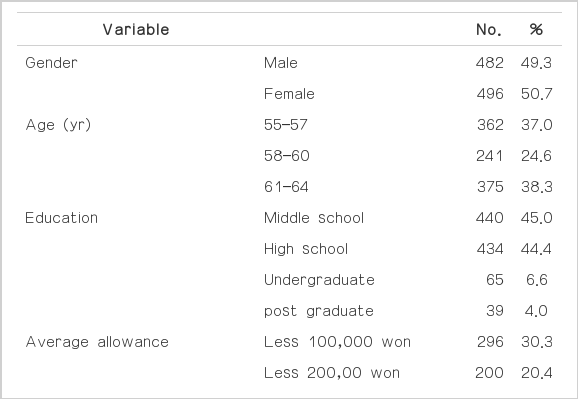
The characteristics of participants
Instrumentation
The initial formulation of the questionnaire was developed by Yi et al. (2010) and Ministry of Culture, Tourism and Sport (2010). The researcher established some variables that were unique characteristics and closed involved with pre-elders’ environments. The factors in this questionnaire contained 25 variables influencing pre-elders’ leisure activities (Table 2).

The construction on the trend of Korea’s pre-elderly adults’ leisure and recreational questionnaire
Survey procedures and data processing
To verify the leisure activity patterns of pre-elderly adults, researchers including chief researcher, four- co-researchers, four assistant researchers visited total of 25 cities; Seoul satellite city (6 places), seven metropolitan cities (7 places), small and medium size cities (6 places), rural area (6 places). Survey was conducted in self-administration method. The completed questionnaires were coded according to the coding instruction and the 978 data was analyzed by using IBM SPSS Windows 20.0 statistical software (SPSS Inc., Chicago, IL, USA). A Frequency analysis, the Chi-square (χ2) and an analysis of variance (ANOVA) were conducted for verifying hypothesis test. The results indicated significant F values, a Tukey post hoc procedure test employed to determine. The statistical significance was set at the 0.05 level.
RESULTS
The pre-elderly adults’ leisure and recreational patterns based on the leisure and recreational research
Table 3 shows analysis of pre-elderly adults’ leisure and recreational satisfaction, happiness level, and differences in participation persistency using one-way ANOVA analysis below (Table 3).
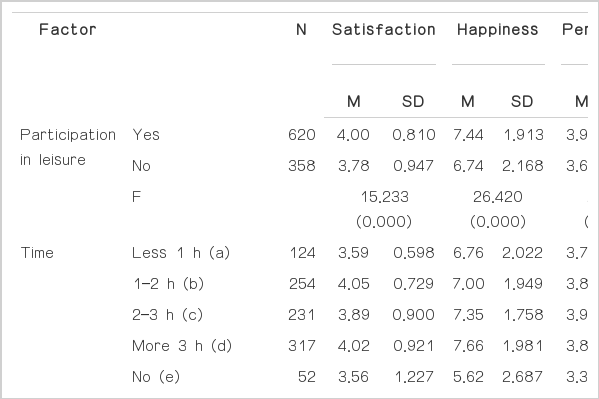
Result of the analysis of pre-elderly adults’ leisure and recreational satisfaction, happiness level, and differences in participation persistency based on the leisure and recreational research
As shown in Table 3, satisfaction of leisure activities depends on participation or non-participation of leisure activities. The leisure activities participation group (M=4.0) was higher than non-participation group (M=3.78) (P<0.001), and the desire to continue leisure activities was also higher for the participation group (M=3.96) than non-participation group (M=3.67) (P<0.001).
According to the leisure satisfaction based on the leisure participating time, while 1–2 h group (M=4.05) scored the highest, non-participants group scored the lowest (M=3.56) (P<0.001).
In the happiness level, while more than 3 h group (M=7.66) was the highest, non-participation group (M=5.62) showed the lowest (P<0.001). The group with express desired to continued participate between 2–3 h (M=3.89) is the most high, the group with no time to participate (M=5.62) showed the lowest (P<0.001). According to the satisfaction by the type of participation in leisure and recreational activities, participation group in the cultural performances (M=4.18) shows the highest, and community service volunteers (M=3.62) was found to be the lowest (P<0.001).
A community service volunteer group shows highest in happiness level (M=7.72), cultural performance group (M=6.44) showed the lowest (P<0.01), cultural performance groups (M=4.21) showed highest in express desire to continued, entertainment groups (M=3.66) was the lowest (P<0.001). In the survey on leisure and recreational satisfaction level based on the frequency of leisure activities, while the groups participates 2–3 times a week (M=4.01) showed highest, group participates once in six months (M=3.23) showed the lowest (P<0.001). The express desired to continued showed highest in the group participates everyday (M=4.30), once in six months group (M=2.84) showed lowest (P<0.001). There has been not much difference shown between the leisure and recreational activities and express desire to continue in a relation to the time spent for the leisure and recreational activity per activity (P<0.05). However, the happiness level based on the time indicates that the groups spent greater than 3 h (M=7.55) showed highest, groups spent 1 h (M=6.64) showed lowest which is a statistically showed significant differences between the groups (P< 0.001).
The satisfaction level by the participation motive for leisure and recreational activities shows that the self-motivated groups (M=4.13) scored highest, other groups (M=3.57) shows the lowest which is a statistically significant differences between the groups (P<0.001). Happiness level (degree of happiness) was high for the groups motivated (M-7.49), the groups motivated through the government agency (M5.86) shows the lowest (P<0.001).
The survey shows that the partner involvement in activities did not showed significant difference in statistically in a relation to the leisure and recreational satisfaction level and express desire to continue participation in leisure and recreational activities in the future. However, in the happiness level, groups participating through clubs (M=7.36) shows the highest and the groups participated with work colleagues (M=6.02) scored the lowest (P<0.001).
Leisure and recreational satisfaction based on the participation purpose indicates that the self-satisfaction groups (M=4.19) was the highest, other groups (M=1.92) shows the lowest (P<0.001). In the happiness level, groups for the purpose of self-satisfaction (M=7.62) was the highest, groups for the purpose of spending time (M=4.00) was the lowest (P<0.001). And, the self-satisfaction groups (M=4.39) was the highest in express desire to continue participation, and other purpose groups (M=1.92) was the lowest (P<0.001). The leisure and recreational satisfaction in a relation to the cost of leisure and recreational activities participation, more than 300.000 won groups (M=4.40) was the highest, the groups with no participation cost (M=3.76) was lowest, a statistically significant difference in the level (P<0.001). The leisure and recreational satisfaction in a relation to the groups joined hobby groups (M=4.14) was highest than the non-joined hobby groups (M=3.87) (P<0.001). Additionally, happiness level also shows groups joined hobby groups (M=8.37) was much higher than the non-joined hobby groups (M=6.90) (P<0.001), the groups joined hobby groups (M=4.10) was much higher than the non-joined hobby groups (M=3.80) in express desire to continue (P<0.001).
Discussion
Leisure and recreational implications for pre-elderly adults
This study conducts survey among the pre-elderly adults group to analyze a pattern of leisure and recreational activities and attempts to provide basic data in a purpose of guiding the academic and policy direction. Therefore, this section, based on the study of current patterns of Korea’s pre-elderly adults, introduces implications for the trend of leisure and recreational activities.
Pre-elderly adults and elderly adults’ heterogeneous aspects of leisure and recreation
According to the result of this study, more than half have continuously participated in the leisure and recreational activities compared to the non-participated in leisure and recreational activities. The more time in the leisure and recreational participation they have, the higher the happiness level, satisfaction in leisure and recreational activities, and express desire to continue leisure and recreational activities in the future. In the type of participation, entertainment groups and sports participation groups was the highest in level of satisfaction, happiness level, and express desire to continue in the future leisure and recreational activities. In addition, the frequency of participation in leisure and recreational activities, the higher the frequencies, the higher the satisfaction, happiness, and express desire to continued participation in the future activities. In the aspects of participation motive, case of internally motivated as such self-motivated was higher in the area of satisfaction, happiness, continue participation, and the purpose of participation was the highest in the area with purpose such as peacefulness, relaxation, personal relations, stress relief, self-development, and self-satisfaction than simply for the purpose of spending time. The only difference showed in regard to partner participation was happiness level but participation friends and affiliated hobby groups’ showed highest in happiness level. Also, in the analysis based on the cost of participation, the higher leisure participation cost groups showed higher satisfaction level than the lower leisure participation cost groups, and the groups affiliated with the hobby groups much more satisfied than the groups are non-affiliated with hobby groups. The sports participation scored the highest in the area of desired to participate in leisure and recreational activities in the future, and the events that require active movements such as sightseeing, and watching sports events were preferred in order.
Overall, these results indicate that between the pre-elderly adults and leisure and recreational activities have close connection. As seen in this study, the higher intensity and frequency in leisure and recreational activities, higher the level of satisfaction in leisure and recreational activities and happiness level. In addition, participating in active leisure and recreational activities shows higher satisfaction level, happiness level and participating with others increases happiness level so that the personal relationship can be built through the participation rather than participating independently.
These results showed the differences with the elderly adults living in a present time. According to the 2011 survey on status of elderly adults’ leisure and recreational activities of elderly adults, about a third of 65 yr took a trip, the usage of computer and internet was 12.8%, participating rate in the continuing education program (6.7%) was respectively lower compared to this research. In addition, elderly adults who participated in leisure and cultural activities was 27.3%, participated in social gathering activities 37.4% affiliation with hobby groups activities 3.8%, political and social parties activities 0.7%, currently, participating in community volunteering activities was 3.9% which is very low. In the meantime, participation rate in all leisure and recreational activities including sightseeing, computer/internet, leaning (continuing education), exercise and leisure and cultural activities was 72.2%, and in the satisfaction level 38.0% was positive and 30.0% displayed negative attitudes towards leisure and recreational activities (Oh, 2012). There are significant differences between pre-elderly adults and elderly adults. The current elderly adults participate in leisure and recreational activities mainly as a tool for building relationship with friends who are in a similar age compared to the pre-elderly adults. As the previous studies point out, leisure and recreational activities are used as a way to relieve the sense of alienation after the retirement (Kweon, 2004; Na, 2002; Yoon, 2002). However, the pre-elderly adults participate in sports to prepare for elderly adults and to promote their health. In other words, compared to the current generation of elderly adults, the generation baby boomers participate in sports activities under the pretense of preparing for a healthy and vibrant life for the future. This longitudinal study attempted by Verbrugge et al. (1996) points out that due to the difference in productive activities and social activities, age related differences can appear in leisure and recreational activities. In the same vein, Yi (2007) and Park and Yim (2007) argue active physical activities of pre-elderly adults generation seems to be gradually reduced as they reach the elderly adult’s generation.
From the successful aging to productive aging through resilient leisure
For elderly adults, an important paradigm of aging process is successful aging which successfully ends their lives, actively live their lives, and fulfill individual needs of life. In other words, paradigm of successful aging process simply based on one-dimensional; focuses on life satisfaction, interaction with others, sense of purpose, self-acceptance, personal growth, and self-help are the basic components (Fisher, 1995). Previous studies also indicated leisure and recreational activities, healthy and meaningful activities and financial stabilization play an important role in the successful aging process for the elderly adults (Bikson and Goodchilds, 1988; McGuire et al., 1996; Na, 2002). In other words, participating in leisure and recreational activities it-self is considered as a crucial tool of successful ageing. Therefore, in the transition period to new paradigm, the role leisure and recreational activities for elderly adults generation is becoming more and more important rather than the elements of the aforementioned successful aging (health, meaningful activities, others will need, financial stabilization).
According to the national Statistical Office’s data on the pre-elderly adults (Bae, 2012), while 61% respond they are not ready for preparation for their old age, only 39% are ready for that. As the development of medical technology lead to extend healthy life expectancy, previously defined concept about aging should be chang ed. With extension of retirement age and emphasis on social participation of elderly adults, aging process should not simply considered as a closing of one’s life rather, switching to positive social image as a concept of reproduction. The Department of Health and Human Services has already created jobs for the elderly adults through expanded opportunities for social participation and various efforts are being added to solve problems with elderly adults. As such, the meaning of productive aging, a new paradigm is enough to make you think. We will refer this creation of new paradigm comes from productive environment as a new productive aging. A productive aging refers to all activities performed by elders in ability to produce products or development of ability to produce goods or services, regardless of exchange material rewards (Caro et al., 1993). In recent years, activities such as self-protection to maintain the independence of individual activities are included (Birren and Cochran, 2001; Butler, 2002). Although the existing concept of productive aging includes community volunteer service, aids others unanimously, self-care, and civil participation involvement activities (Chung et al., 2009), in the future, productive aging will include the ability to maintain individual independence activities.
Thus, the prerequisite for productive aging is the recovery through the leisure and recreation. In other words, to pre-elders, leisure and recreation can be a critically important tool to secure resilient recovery. According to Yi and Ahn (2010) and Yi et al. (2011)’s research on the relationship between leisure activities and resilient recovery, leisure and recreational activities have been treated as an element that influences life of happiness as they can gain revitalization through participating in leisure and recreation. Thus, as you can understand through the research on the patterns of pre-elderly adults, physical activities help them to not only obtain physical health but also recover resilience.
CONCLUSIONS
There is an old tale “the life starts at the age of 60”. If we re-interpret it in elderly adult’s point of view, the old tale means that the elderly adults have entered elderly period of their lives, but the mind and the activity level is sufficient enough. Recently, as more baby boomers became the target of interests, the concerns for the preparation for old age of pre-elderly adults have been also raised. A recent newspaper article points out that the overall employment rate in Korea, 74.3% in 2012 employment rate and the by the time the baby boomer reach the retirement era in 2017, a total of 725,000 people of pre-elderly adults will be retiring which the employment rate will maintain at the 65% could resulted in cancellation of retirement (Chosun Ilbo, 2013. 05. 06). In addition, the baby boomer generation is now facing the responsible for supporting their children’s education as well as caring their parents. Therefore, the leisure and recreation for pre-elderly adults should not be viewed as a tool for the economic gain but rather, voluntarily used for the recovery resilience. In particular, as seen in this study, the more time, frequency and intensity in leisure and recreational participation, the higher the satisfaction level and the happiness level in their life. It means that leisure and recreational activities play an important role for their life. In other words, for pre-elders, leisure activities can be regarded as the important element for preparation of their old age. Therefore, the leisure and recreation for pre-elderly adults should not be recognized as a tool for improving the economic productivity but for reinforcing the recovery resilience.
Acknowledgements
This work was supported by the National Research Foundation of Korea Grant funded by the Korean Government (NRF-2012-S1A5A2A03-034025).
Notes
CONFLICT OF INTEREST
No potential conflict of interest relevant to this article was reported.