Relationships between lower limb muscle architecture and activities and participation of children with cerebral palsy
Article information
Abstract
The purpose of this study was to determine the effects of the structure of skeletal muscle of lower extremities on function, activity, and participation of children with cerebral palsy. The subjects were 38 hospitalized patients and 13 infants with normal development. The following clinical measures were used for assessment of activity daily living and functional level of gross motor: Gross Motor Function Classification System (GMFCS), Gross Motor Function Measure (GMFM), Wee Functional Independence Measure (WeeFIM), International Classification of Functioning Child and Youth (ICF CY). Muscle thickness and strength of knee extensor and ankle extensor were collected using ultrasonography and manual muscle tester. Following the results of ICF CY evaluation for body function, activity, learning and application of knowledge, communication and environmental factors showed a decline (P< 0.05). Significant differences in the thickness of muscle was observed according to the GMFCS level, thickness of knee extensor and ankle extensor of cerebral palsy (P< 0.05), and clauses of self-care, activity, mobility, ambulation, communication, and social acknowledgement (P< 0.05). Following analysis, results showed negative correlation in the thickness of muscle, muscle strength, major motor function, daily activity and participation; the score of ICF-CY was shown to decline due to the high score for differences in thickness of muscle, muscle strength, WeeFIM, and GMFM. The thickness and muscle strength of lower extremities affect main functions of the body and improvement of muscle strength of lower extremities may have positive effects on social standards such as activity and participation of cerebral palsy.
INTRODUCTION
Cerebral palsy is a disability in motion and posture development according to non-progressive damage occurring in the brain that accommodates motor disability as well as sense, cognition, disability of communicative expression, behavior disability, and convulsion (Bax et al., 2005).
The feature of motor disability of cerebral palsy leads to limitation of body activity due to lack of motor experience and therefore causes developmental delay of sensation, development in perception, formation of motor memory, and sociability (Elder et al., 2003). Cerebral palsy is associated with several diverse problems in the nervous system and skeletal system, such as spasticity, contracture, non-coordinated movement, decrease of selective movement, weakness etc. Due to the above mentioned problems, cerebral palsy can cause many restrictions on social activity and participation (Gormley, 2001).
Muscle strength is highly correlated with the quantity of muscle (Ohata et al., 2008). Children with cerebral palsy show weakened muscle due to lack of motor unit activation and thickness of 50% of small muscles, compared to children with normal development (Lampe et al., 2006), cerebral palsy with capability of independent ambulation also had limitation on muscle contraction in that its greatest ability of muscle contraction only reached 52% of that of normally developed children (Wiley and Damiano, 1998). In particular, when formation of gastrocnemius measured by ultrasound wave was compared with that of normally developed infants, they received constant negative effects as a result of thickness of gastrocnemius and angle of the ankle showed a greater decline (Gao et al., 2011). In addition, quadriceps femoris muscle is absolutely important for movement from sitting position to standing position, climbing up and down stairs, adjusting for against gravity when ambulating in stance phase and performing other functional activities (Mizner and Snyder-Mackler, 2005); muscle strength in weakened quadriceps femoris muscle of cerebral palsy may bring a bad result on GMFM formed with standing, walking, running, and jumping (Goh et al., 2006).
With these facts, it causes an abnormal motion pattern due to weakening of this muscle groupand learned non-use effect, which is a secondary cause. This would again affect body function in a negative way causing muscle atrophy and abnormality of muscle structure (Moreau et al., 2010). However, study on muscle structure and body function of cerebral palsy is insufficient. More study of muscle structure is important for providing information for use in forecasting other disabilities and activity standards of cerebral palsy (Moreau et al., 2010).
Therefore, the purpose of this study is to investigate structure of skeletal muscle of lower extremities, muscle strength, and body function and provide basic materials and principles necessary for establishment of a treatment goal and intervention method by comparing the body structure and function, relationship between activity and participation.
MATERIALS AND METHODS
Subjects
This study was conducted for 38 infants with cerebral palsy and 13 infants with normal development diagnosed as cerebral palsy undergoing physical therapy treatment at Kyunggido G rehabilitation hospital. Among the subjects, specific selection conditions for children with cerebral palsy were as follows. After explaining the purpose of the study to guardians of children diagnosed cerebral palsy and with a child permitted to be studied, some were excluded for less than six months after undergoing orthopedic surgery or neurotmesis surgery, less than three months after undergoing Botulism and Baclofen surgery on the measuring area and with epilepsy (Thorpe, 2011).
Outcome measures
Movable ultrasound wave measurement (Mysono U5, Medison Korea, 2009) was performed for measurement and examination of the internal structure of the rectus femoris and gastrocnemius. The method for examination was to make sure that subjects were in a comfortable prone position, with the knee extended, the muscle thickness of gastrocnemius was determined by measuring the distance between superior aponeurosis and inferior aponeurosis of gastrocnemius (Smith et al., 2013). High intrarater (ICC=0.98–1.0) and interrater (ICC=0.93–0.98) reliability have been demonstrated using this measure (McNee et al., 2009).
GMFCS (Gross Motor Function Classification System)was used for classification of standards for gross muscle motor function of children with cerebral palsy. GMFCS classify disability rate as five levels for each age group; I level indicates a minor case, II, III a middle case, and IV, V a serious case level (Palisano et al., 1997). This study excluded levels IV, V, which are difficult for functional activity and compared with other factors based on materials for children(Palisano et al., 1997). The intrarater reliability of GMFCS is r=0.93 and r=0.79 for test-retest (Wood and Rosenbaum, 2000).
The manual muscle tester (model 11001163, Lafayette Instruments, USA, 2003) was used for assessment of muscle strength for knee extensor and ankle plantar flexor. When knee extensor was measured, the subject sat on a chair trunk-fixed, flexed knee to degree of 90 and operated maximum voluntary isometric contraction of knee extensor. For measurement of ankle plantar flexor, the subject sat on a chair trunk-fixed, fixed under the heel of the foot by a foot rest to support an ankle in order to not move from central position in position of flexed knee and ankle joint to a degree of 90. After that, we operated maximum voluntary isometric contraction. We performed measurements three times for both sides with muscle strength measurement examination and applied by calculating the average value (Krebs et al., 2007). High intrarater (r=0.84–0.99, r=0.84–0.94) and interrater (r=0.98–0.99) reliability have been demonstrated using this measure (Bohannon and Andrews, 1987).
Gross Motor Function Measure (GMFM) was used for assessment of Gross motor function of the subjects. GMFM was divided by five areas, and formed with 88 articles. Scores for each section are summed, and divided by 5 for the total score of GMFM. This evaluation is used for evaluation of overall standards for gross action motor function of subjects by evaluating their accomplishments rather than their performing clauses (Damiano and Abel, 1996). Intrarater (r=0.77, r=0.88) and interrater (r=0.68) reliability have been demonstrated using this measure (Damiano and Abel, 1996; Palisano et al., 1997).
Wee Functional independence measure (WeeFIM) was used to evaluate health, development condition, education standards and local community standards of subjects. WeeFIM consists of 18 clauses of a total of six categories (Liuet., 1998). The lowest score is 18, with a total score of 126 (Sanders et al., 2006). Intrarater (r=0.92) and interrater (r=0.81) reliability have been demonstrated using this measure (Ottenbacher and Msall, 1997). International Classification of Functioning Child and Youth Check List (ICFCY Check List) was used for evaluation of the degree of disability and overall health condition of subjects.
ICF-CY Check List is a summary version consisting of main core sections for ICF-CY, which evaluates disability and health conditions of children and youth. This study only shows the result of evaluation of the area of body function, activity, and participation from the forming factors of ICF-CY for 7–12 years old according to the age of subjects and purpose of the study. Eight areas (mental function, sensory function and pain, voice and speech function, cardiovascular system function, motor activity-related function, etc.) are included in body function of evaluation clauses and area of activity and participation consists of nine, which are learning and application of knowledge, general tasks and demands, communication, self-care, interpersonal interactions, and relationships; each section can be evaluated from a score of 0, which indicates no difficulty in performing, to a score of 4, which indicates the need for whole assistance.
Statistical analysis
All statistical analysis were performed using SPSS 18.0. The data showed normal distribution using the normality test following the Shapiro-Wilk theory of hypothesis testing. Independent t test was used for comparison of the result of ICF-CY check list between groups. ANOVA was used for comparison of GMFCS with muscle thickness, muscle strength of lower extremities, WeeFIM, correlation analysis to examine correlation between activity and participation clauses of muscle thickness, muscle strength, GMFM, WeeFIM, and ICF-CY check list. A result below 0.05 was considered statistically significant.
RESULTS
General characteristics of subjects
The general characteristics of subjects were as follows Table 1. Subjects included eight boys (13%), five girls (8%) among 13 infants with normal development, and 21 boys (35%), 17 girls (26%) among 38 infants with cerebral palsy. The average age of infants with normal development was 79.62 months, and that for children with cerebral palsy was 66.61 months, average height of normal children was 120.27 cm, and that for children with cerebral palsy was 107.61 cm. Average weight of normal children was 21.33 kg, and that for children with cerebral palsy was 18.32 kg.

General characteristics of subjects
ICF-CY checklist comparison
Differences in ICF-CY score between infants with normal development and those with cerebral palsy were as follows Table 2. Significant differences in clauses of body functions were observed between the two groups; the average score for infants with normal development was 0.00 and 0.60 for those with cerebral palsy (P< 0.001). Significant differences in clauses of mental function were also observed between the two groups; the average score for infants with normal development was 0.00 and that for those with cerebral palsy was 1.09 (P<0.001). However, no differences in sensory function and pain, voice and speech function were observed between the two groups (P>0.05). Significant differences were observed in clauses of activity; the average score for infants with normal development was 0.00 and that for those with cerebral palsy was 1.58 (P<0.001). Significant differences were observed in all low lank of clauses in learning and application of knowledge, general tasks and demands and acceptance, communication, etc. (P<0.01). Significant differences in environmental factors were observed between groups of items and mechanic clauses (P<0.01). However, no differences in support and relationship, attitude were observed between groups of clauses (P>0.05).
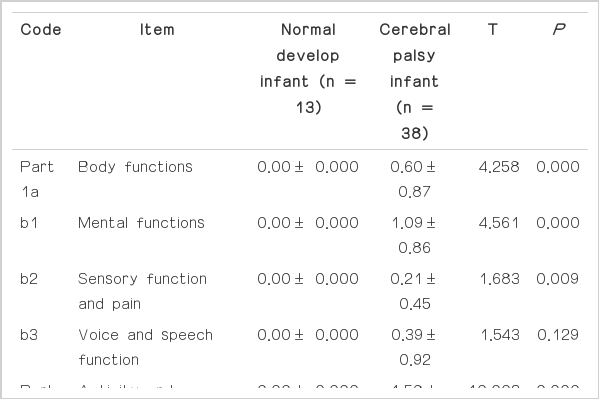
ICF-CY check list comparison
GMFCS’ steps for muscle thickness, muscle strength, and WeeFIM of cerebral palsy comparison
Results of comparison of muscle thickness of cerebral palsy, muscle strength, and WeeFIM, which were divided into three groups according to levels of GMFCS were as follows Table 3. Significant differences of muscle thickness were observed according to postures of rectusfemoris in GMFCS, compared with the average of 4.23 mm on level I, 2.10 mm for GMFCS level II, and 2.08 mm on GMFCS level III (P<0.01). Significant differences were observed in GMFCS level I of knee extensor’s muscle strength; the average was 11.61 kg on GMFCS level, 6.83 kg on GMFCS level II, and 6.55 kg on GMFCS level III (P<0.05). Significant differences were observed in muscle strength of ankle extensor; that for the average of children on the GMFCS level I was 9.80 kg, GMFCS level II was 6.08 kg, GMFCS level III was 4.27 kg (P< 0.01). Significant differences were observed in self-care; that of the average of children on GMFCS level I was 40.00, GMFCS level II was 31.50, and GMFCS level III was 20.23 (P<0.01). Significant differences were observed in communication clause; that for the average of children on GMFCS level I was 14.00, GMFCS level II was 11.50, and GMFCS level III was 9.77 (P<0.05). Significant differences were observed in social acknowledge; that for the average of children on GMFCS level I was 21.00, GMFCS level II was 17.50, and GMFCS level III was 14.50 (P<0.05). After the examination, the result showed differences in postural muscle thickness, with thicker muscle for GMFCS level I of cerebral palsy compared with children on GMFCS level II, III. Muscle strength of knee extensor and ankle extensor of GMFCS level I showed better muscle strength than GMFCS level II, III. Scores for clauses of self-care activity, movement, ambulation, communicative expression, and social acknowledgement for GMFCS level I were better than those for GMFCS level II and GMFCS level II, which were better than those for GMFCS level III.

Comparison of muscle thickness, strength and WeeFIM between GMFCS level
Correlation of muscle thickness and muscle strength, Gross Motor Function Measurement, activity of daily living, and ICF-CY was as follows Table 4. All clauses showed negative correlation, with a better score for differences in muscle thickness, muscle strength, WeeFIM, and GMFM, the lower the score getting clauses of ICFCY. The greater the differences shown in muscle thickness of rectus femoris, the higher the activity and participation shown in ICF-CY (r=−0.342, P<0.05). Muscle strength of knee extension (r=−0.432, P<0.01) and muscle strength of ankle extension (r = −0.504, P<0.01), as well as higher activity for ICF-CY were demonstrated. Muscle strength of knee extension (r=−0.435, P<0.01) and muscle strength of ankle extension (r=−0.505, P<0.01), as well as higher participation of ICF-CY were demonstrated. Results showed a higher total score for GMFM (r=−0.748, P<0.01) and WeeFIM (r=−0.092, P<0.01), and a higher score for activity of ICF-CY. A higher total score was observed for GMFM (r=−0.746, P<0.01) and WeeFIM (r=−0.092, P<0.01) with a higher score for participation of ICF-CY.
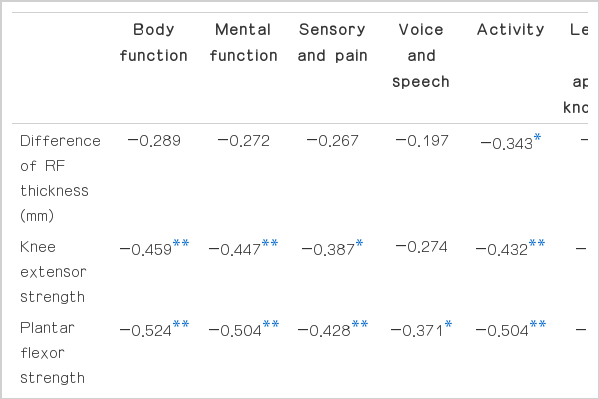
Correaltion between muscle thickness and strength, ADL and ICF-CY
DISCUSSION
Muscle thickness, muscle strength and the score of WeeFIM were compared to the disability depending on body features for children with cerebral palsy. First, significant differences were observed through careful examination in standing and supine position for each level of GMFCS depending on differences of the rectus femoris muscle. Previous studies have reported significant differences between thickness of the rectus femoris in infants with cerebral palsy and those with normal development of the same age (Moreau, et al., 2010), as well as significant relationship between thickness of skeletal muscle and muscle strength (Akagi et al., 2008). The reason why the significant differences for each section of GMFCS were not shown in this study was that otherwise the subjects participated in a previously conducted study which included subjects with serious cerebral palsy with GMFCS level I–III and those with cerebral palsy for whom ambulation is possible, which is GMFCS level I–III in this study. The result of this study showed significant differences in muscle strength of knee extensor and ankle extensor depending on the level of GMFCS (P<0.05). The ankle extensor supports the body and takes part in ambulation pattern from middle stance phase in the case of normal ambulation; cerebral palsy has shown the phenomenon of increase to knee and high joints of legs due to ankle joint lower side curve not properly working on stance phase (Neptune et al., 2001). The reason that the ankle extensor’smuscle strength depending on the levels of GMFCS has significant correlation is that its muscle regulates ambulation delicately (Damiano et al., 2001). Although operation of the rectus femoris is an important part of performance of gross motor functions such as sitting to stand, climbing up and down the stairs (Mizner and Snyder-Mackler, 2005), the ankle extensor has priority over taking charge of regulating changes in ground, which is an irregular occurrence and movement of weight if ambulating without use of anassistive device or ambulation outside. Therefore, its correlation with ankle extensor is regarded as highly dependent on each level of GMFCS.
Motor defect that accommodates cognition, auditory sense, visual sense, communication, and behavior disability can cause difficulty and include characteristics for regulation of selective motion activity and separative muscle regulation for isometric contraction (Bax et al., 2005). Disability that is dependent on motor action defect has also been shown in cases of cerebral palsy. In particular, gross motor action performing capacity showed differences depending on the degree of impairment of cerebral palsy; in this study, significant differences in muscle strength were observed between GMFCS level I and III. It is possible to walk both indoors and outdoors and participate in physical training activity and sports without any assistance in level I; however, for ambulation indoors, those on level III ambulate primarily by use of an assistive device (Palisano et al., 1997). Therefore, differences were observed in motor action activity when divided by GMFCS, even the same for cerebral palsy; activity and participation in daily life in schools and with friends, and motion of daily activity will improve if they can develop their mobility ability.
The result of investigation of the correlation between muscle characteristic and daily living-related index of cerebral palsy showed that the better the differences in thickness of postural rectus femoris (r=−0.343, P<0.05) and muscle strength of knee extensor (r=−0.432, P<0.01) and ankle extensor(r=−0.504, P<0.01) were, the higher activity standards of daily living and degree of participation were revealed. In addition, a high level of concern in standards of activity and participation of gross motion function score has been demonstrated (r=−0.746, P<0.01). Significant differences were observed in self-care activity, mobility, ambulation, communicative expression, and social cognition according to the level of GMFCS. In addition, it has been checked out that self-care activity, bladder and bowel control, mobility, communication and social cognition of knee extensor’s muscle strength can be changed (P< 0.01). Moreau (2010) stated that the standard of movement has a significant effect on participation in activity of daily living (Moreau et al., 2010; Ohata et al., 2008; Pirpiris et al., 2006). Understanding degree of muscle training and behavior performance has shown that participation rate was great if the standards of cognition were high (Andersson et al., 2003); looking at the previously conducted study and the result of this study, exercise of muscle strength can be a ground for improving the function of gross motor performance and sustaining the daily living of life.
The result of this study showed that the score for self-care activity, movement, and ambulation function increased when the application of learning and knowledge was easy and the score for clause of general requirement and reception, communication was high (P<0.01). There would be a circumstance of social behavior or movement, such as self-care activity, mobility, and ambulation based on the function if the function improves. These clauses are definitely necessary for social living, which also has an intimate connection with home, relationship with people, community living, and social living.
In general, if a child with cerebral palsy used constant treatment service after the diagnosis, using the treatment service would be decreased at the point in time of school-age, so that their overall health condition will easily deteriorate and worsen due to the decrease of mobility and increase of pain standard (Andersson and Mattsson, 2001). With this result, it can affect the quality of life of children with cerebral palsy in a negative way, leading to a decrease in exercise function and standard of activity and participation. Considering this matter, showing the whole and effective intervention method of treatment making use of ICF-CY based on family-centered treatment including hospital-centered treatment service from before school age would be effective for improving the quality of life of children with cerebral palsy.
Only 13 infants with normal development and 38 infants with cerebral palsy were included in this study; therefore, the two groups did not include the same number of participants. Due to that fact, there is a possibility that the result of this study may not adequately reflect the tendency of the whole group. When writing a survey for the degree of social participation of subjects, it has been written by the result of a survey of parents, so that there is a possibility of not examining the exact standard for the degree of realistic social participation.
CONCLUSIONS
The purpose of this study is to evaluate the structure of lower extremities’ skeletal muscle, muscle strength, and standard of body function and compare the relation between body structure and function, activity and participation. The result of this study has shown that the activity degree of ICF-CY was high if the differences in muscle thickness of rectus femoris become greater in-correlation between muscle thickness, muscle strength, activity of daily living and activity and participation. The rate of participation in ICF-CY has been high if the differences in muscle thickness of rectus femoris become greater. The muscle strength of knee extension and ankle extension, activity and participation rate of ICF-CY was high. A higher total score of GMFM and WeeFIM indicated a high rate of activity and participation of ICF-CY. Therefore, the thickness of lower extremities skeletal muscle and muscle strength of cerebral palsy affect function and improvement of muscle strength affects the activity and participation of children with cerebral palsy.
Notes
CONFLICT OF INTEREST
No potential conflict of interest relevant to this article was reported.