


INTRODUCTION
The benefits of cardiac rehabilitation have long been investigated. Several studies have shown that exercise rehabilitation (ER) not only enhances functional capacity, cardiac function, and quality of life but also reduces mortality and morbidity in patients undergoing percutaneous coronary intervention (PCI), those with heart failure, and those with stable coronary artery disease (Goel et al., 2011; Hambrecht et al., 2004; Olsen et al., 2018; Yang et al., 2017).
Cardiopulmonary exercise testing (CPET) is now widely used for formulating ER prescriptions. Among the CPET indicators, ventilatory aerobic threshold (VAT) has been extensively employed to evaluate pathophysiology in patients with various heart diseases as well as to assess physical activity in healthy individuals (Myers, 2005). Additionally, VAT has been utilized to determine the intensity of the prescribed exercise (Mann et al., 2013).
Promptly and accurately issuing an ER prescription prepared 1 day after PCI during hospitalization allows for early initiation of ER in patients with stable angina undergoing elective PCI. The advantages of this swift ER prescription post-PCI based on CPET are: (a) an early start to ER, (b) eliminating the need for a later visit to undergo CPET for the ER prescription, and (c) enhancing and maintaining motivation for ER. However, conducting CPET 1 day after PCI raises certain concerns as well: (a) the exercises might lead to adverse effects, and (b) the CPET parameters obtained 1-day post-PCI might not align with those captured 1–3 weeks post-PCI.
Coronary lesions are small relative to the whole body. With advancements in PCI technology, elective PCI for patients with stable CHD is now performed in a short time with minimal invasiveness. Based on these considerations, we hypothesized that (1) CPET can be performed safely up to the VAT level and (2) the CPET parameters, including VAT, workload, and metabolic equivalents (METs) at VAT obtained 1-day after PCI might not be significantly different from those obtained 1–3 weeks after PCI.
However, to the best of our knowledge, no studies have conducted CPET 1 day after elective PCI or compared the CPET parameters from one day post-PCI to those from 1–3 weeks post-PCI. Accordingly, the present study was carried out to test the two aforementioned hypotheses.
MATERIALS AND METHODS
Patients
The reproducibility study was conducted at the Okayama Heart Clinic. We analyzed 15 patients with stable CHD who agreed to participate in two CPET sessions at the clinic using a bicycle ergometer: one session the day after their elective PCI and another 1–3 weeks (13±4.6 days; range, 7–21 days) post-PCI. All 15 patients had preserved left ventricular function and non-elevated levels of N-terminal prohormone of brain natriuretic peptide. Informed consent was obtained from each participant, and the informed consent form outlined the study’s objectives, advantages, disadvantages, and safety concerns. Patients who were unable to perform the exercise test using a bicycle ergometer were excluded. Furthermore, we excluded those patients who underwent PCI for chronic total occlusion, those who had coronary bypass grafting, and those with three-vessel lesions.
The required sample size was >7 patients to detect a correlation coefficient of 0.90 with a power of 0.8 and a significance level of α=0.05 between two sessions in a correlation analysis. All examinations and analytical procedures adhered to the principles of the Declaration of Helsinki, and the study was approved by the Institutional Ethics Committee for Human Research of Okayama Heart Clinic (approval number, RT2). Written informed consent for the use of data without personally identifiable information was obtained from all patients.
Percutaneous coronary intervention
PCI was performed in the afternoon of the day of admission, and discharge was scheduled for the 2nd hospital day. Aspirin, heparin, and antiplatelet agents (e.g., clopidogrel) were administered before PCI. An intravenous heparin bolus of 0.25 mg/kg was administered during PCI, followed by continuous intravenous infusion of heparin at 0.125 μg/kg/min to maintain an activated clotting time of 350–400 sec. First, coronary angiography was performed, and the target lesion was identified. Intracoronary nitrate was administered to ensure maximal epicardial vasodilation. Then, the target coronary artery was examined using intravascular ultrasound to determine the size and length of the stent and to facilitate stent placement. Next, a floppy wire was passed through the target lesion. The stent was either directly implanted without coronary predilation or after balloon dilation when necessary. The selection of stents was left to the operator’s discretion.
Cardiopulmonary exercise testing
The drugs administered were unchanged from the first and second sessions. CPET was performed twice: on the day after and 1–3 weeks after PCI. CPET was performed in accordance with scientific standards, using approved equipment in a quiet room designed for this purpose (Balady et al., 2010; Ross, 2003). CPET was conducted by two examiners: a cardiologist and a physical therapist. On day after PCI (2nd hospital day), to avoid changes in the CPET parameters due to the autonomic tone, CPET was performed in the patients in the morning or in the afternoon 2 hours after a meal. In CPET performed the day after PCI, exercise loading was stopped at the VAT to avoid the risk of cardiac accidents. Patients were then discharged 2–4 hours after CPET.
In the second session (1–3 weeks after PCI), patients underwent symptom-limited CPET using the following termination criteria: (a) inability to withstand exercise and (b) patient slowing of pedal rotation rate to ≤55 cycles/min. The exercise intensity on the bicycle ergometer was continuously increased by 5, 7, or 10 W/min after ramping up at rates of 5, 7, and 10 W, respectively, during a 4-min warm-up period. The exercise program depended on the patient’s condition, age, sex, and body weight. CPET was planned to be completed within 8–12 min. The pedal rotation speed was set at 60 cycles/min. Minute ventilation, oxygen uptake (VO2), and carbon dioxide production were monitored continuously with a respiratory mass spectrometer using the breath-by-breath method (CPex1, OG Wellness, Okayama, Japan). The 8-sec moving average of the VO2 was continuously calculated from the instantaneously detected VO2. Surface standard 12-lead electrocardiography parameters were also monitored continuously (Cardimax8 FX-8800, Fukuda Denshi, Tokyo, Japan). The forearm blood pressure was determined every 15 min using the cuff-oscillometric method based on Korotkoff sounds (Tango M2, SunTach Medical, Morrisville, NC, USA, respectively).
The two examiners determined the VAT in accordance with established criteria (Balady et al., 2010; Beaver et al., 1986; Wasserman et al., 1973). The VAT was obtained as a percentage of the reported age- and sex-matched value for the healthy population (Itoh et al., 2013). The percent values of VAT (%AT) and the workload (W), heart rate (beats/min), and METs at the VAT were recorded for statistical analyses (Itoh et al., 2013). After completion of CPET, the VAT was further confirmed by several experienced members of staff.
Statistics
The statistical analyses were performed using R ver. 3.2.2 (R Foundation for Statistics Computing, Vienna, Austria). Simple linear regression analysis was performed using CPET data obtained the day and 1–3 weeks after PCI. Coefficients of regression and correlation were used to determine the reproducibility of the results. Power analysis was performed to evaluate the necessary sample size for the study. Bland–Altman plots were also used to determine the reproducibility of CPET indices between the two sessions. Paired-sample t-tests were used to compare values between the two sessions. In accordance with the sample size, a Shapiro–Wilk test and histogram were used to determine the normality of the distribution. The homogeneity of variance was checked using the F-test. The data are expressed as the mean±standard deviation. Differences with P-values <0.05 were considered significant.
RESULTS
Characteristics of patients
The characteristics of the included patients are shown in Table 1. There were no exceptional cases, such as PCI with notable complications, suggesting that the enrollment process was free of bias.
Characteristics of PCI
Table 1 summarizes lesion characteristics and procedural parameters for the included patients. Procedural time, the volume of contrast medium used, and the level of radiation exposure were approximately 45 min, 50 mL, and 1 gray, respectively.
Safety of CPET
CPET was performed the day after PCI (2nd hospital day), uneventfully and without any complications such as an angina attack. All patients were discharged 2–4 hours afterward. Similarly, CPET was completed without complications 1–3 weeks after PCI.
Comparison between the two sessions via regression and correlation analyses
Paired t-tests were used to compare CPET data obtained the day after and 1–3 weeks after PCI (Table 2). No significant differences in %VAT, workload, heart rate, or METs at the VAT were observed between the two sessions. The coefficients of variation for all four parameters were around 5%.
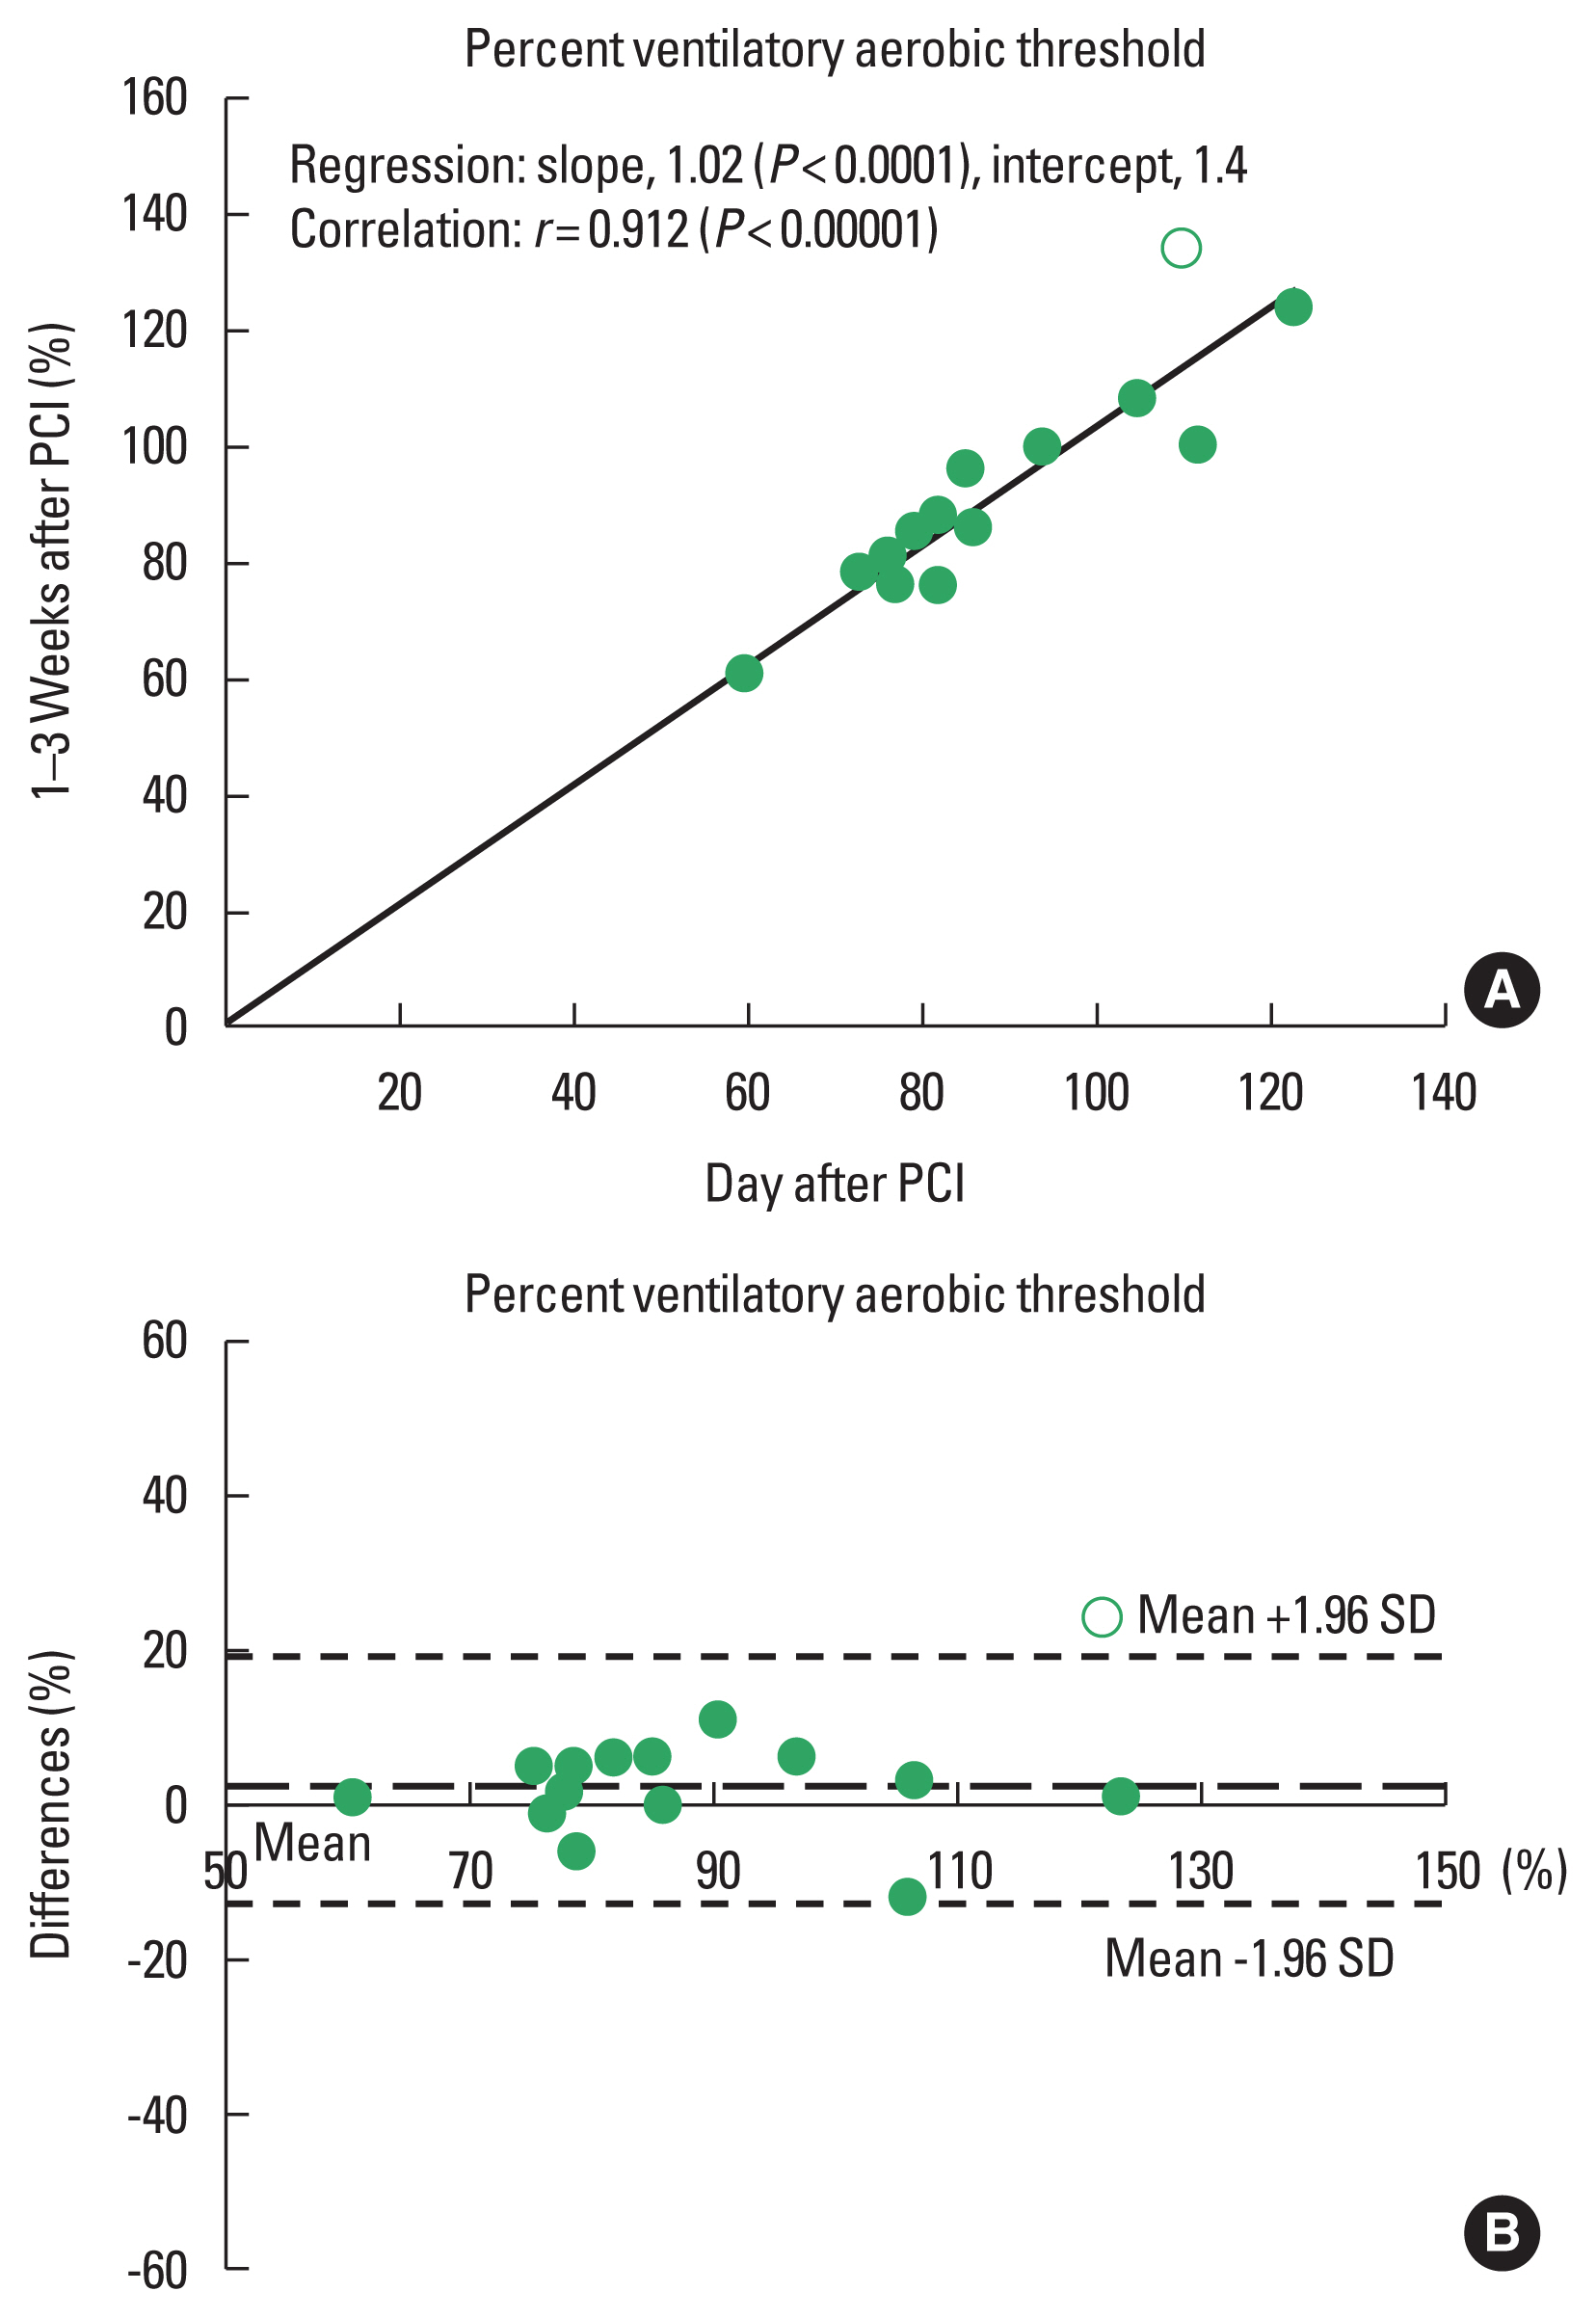
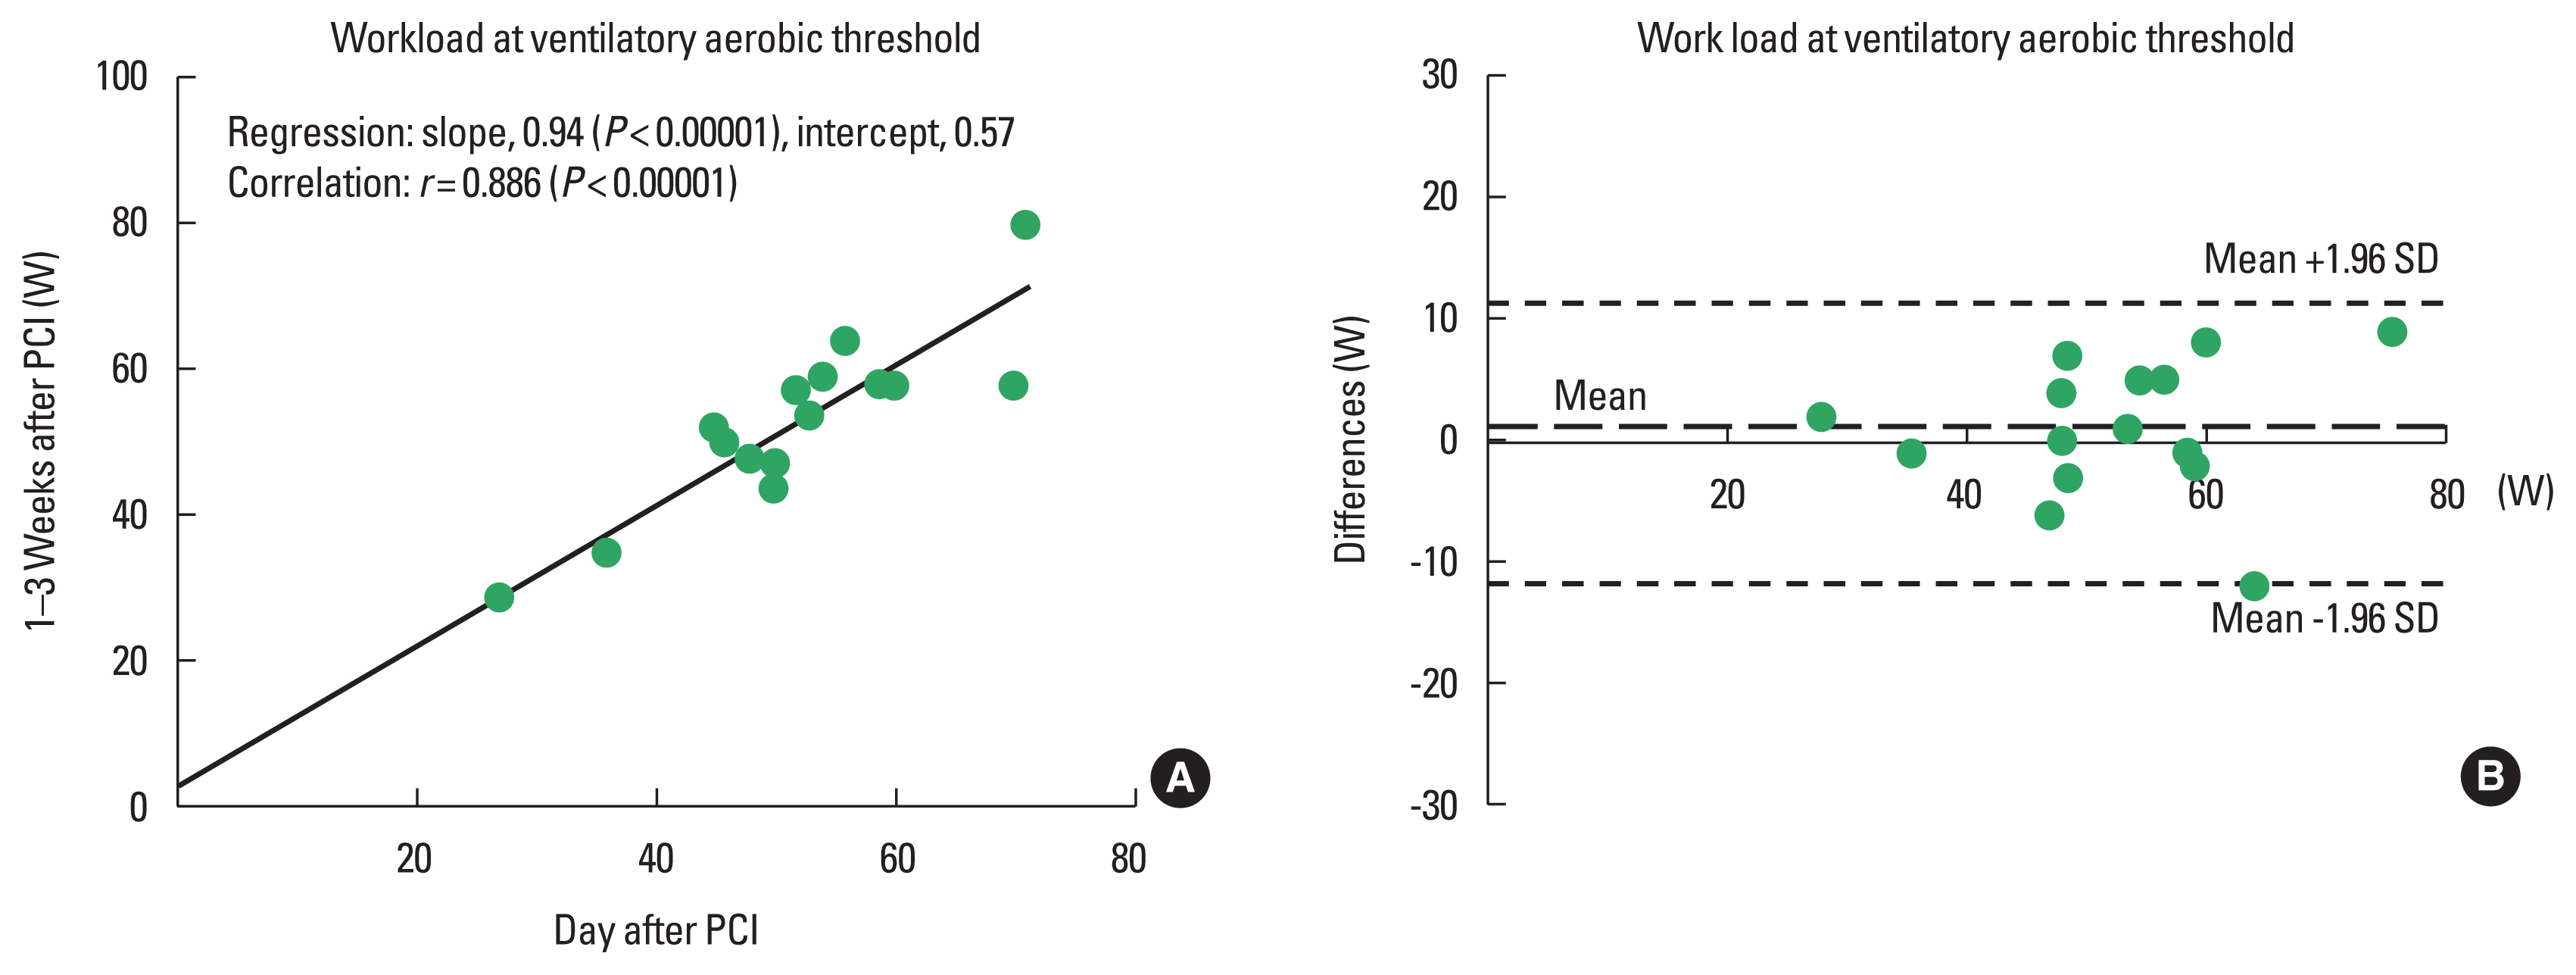
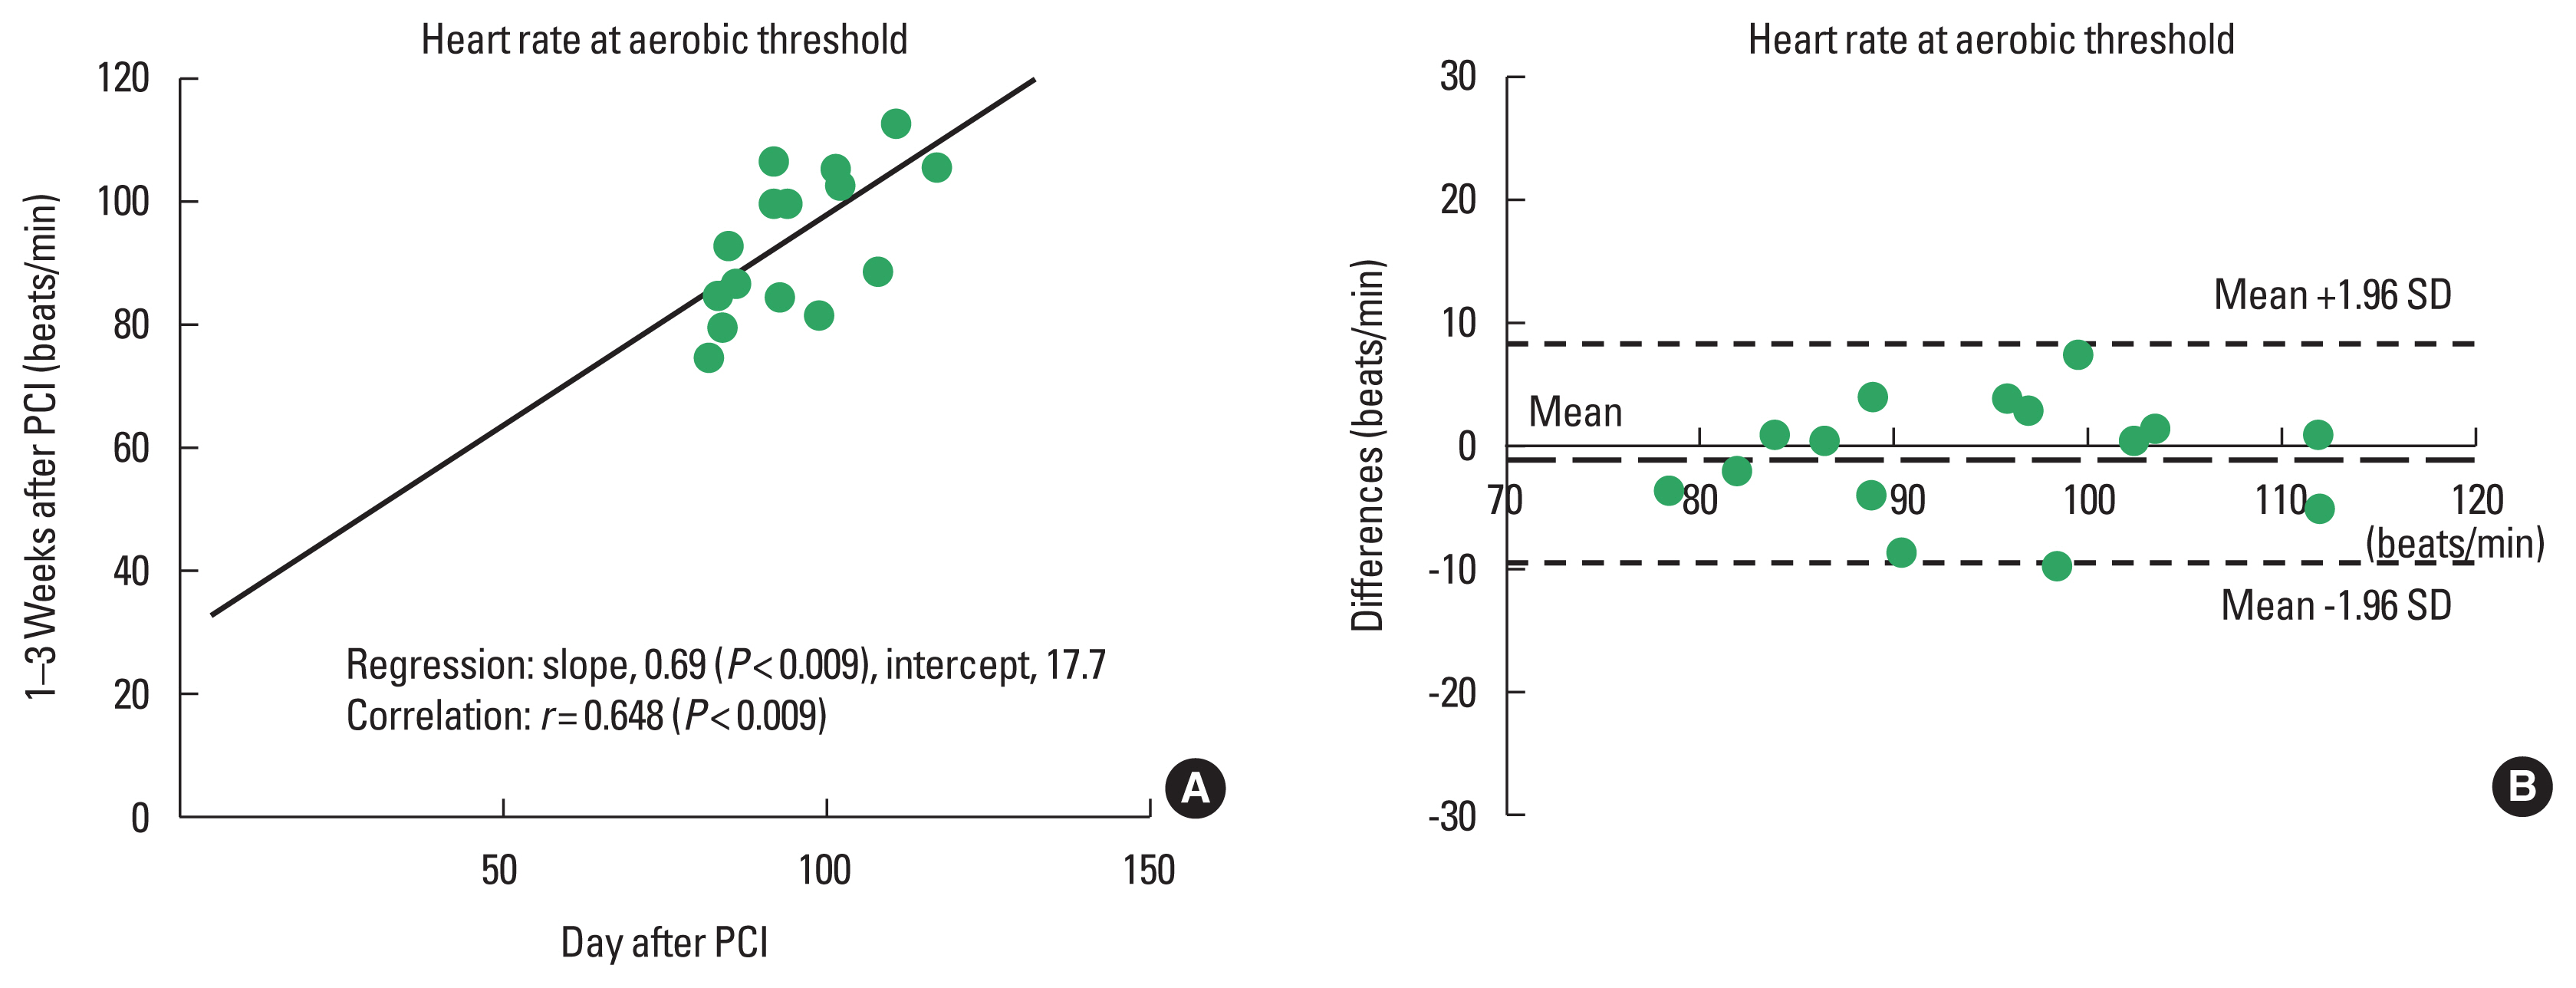
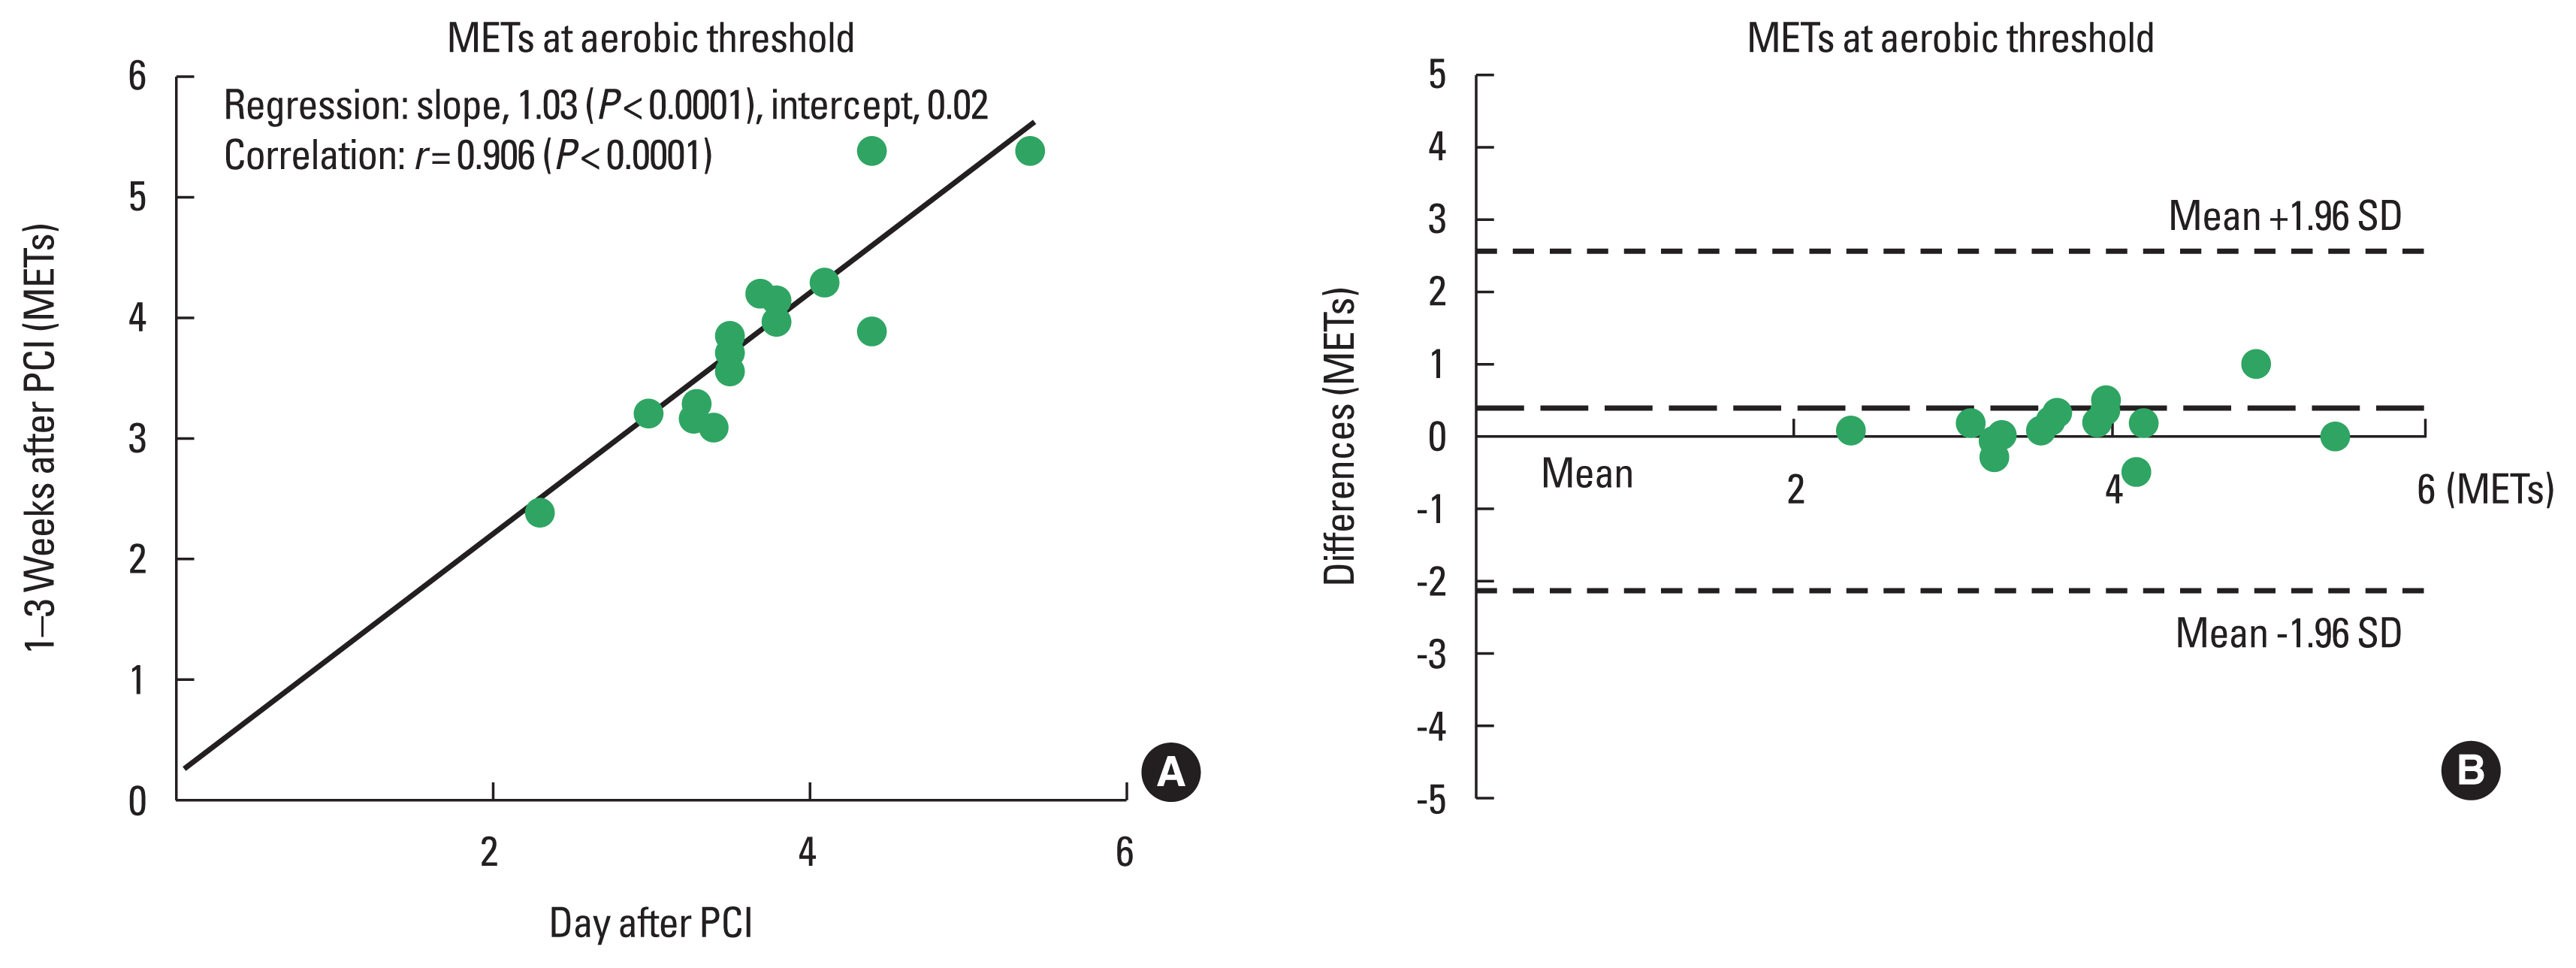
The results of regression and correlation analyses are also listed in Table 3 and shown in the upper panels of Figs. 1Fig. 2Fig. 3–4. The coefficients of regression and linear regression intercepts were close to 1 and 0 for %VAT and for workload/METs at the VAT, respectively. The regression line for heart rate at the VAT deviated slightly from the line y=x. Correlation coefficients were high (approximately 0.9) for %VAT, workload at the VAT, and METs at the VAT. The correlation coefficient for heart rate at the VAT was somewhat low but significant.
The number of days from 1st to 2nd CPET sessions did not correlate with any of the differences in CPET parameters of %VAT, workload, HR, or METs at VAT obtained between one day and 1–3 weeks after PCI.
Bland–Altman analysis
Bland–Altman plots for %VAT and workload, heart rate, and METs at the VAT are shown in the lower panels of Figs. 1Fig. 2Fig. 3–4. All plots demonstrated acceptable reproducibility between measurements obtained the day after and 1–2 weeks after PCI, except for the %VAT and METs at the VAT. These two parameters were close to +1.96 standard deviation of the differences’ average.
DISCUSSION
This study was conducted on patients with uncomplicated stable CHD and had two notable findings. First, CPET could be safely performed up to the VAT point one day after PCI. Second, the CPET parameters can demonstrate clinically acceptable reproducibility between measurements taken one day after PCI and those taken 1–3 weeks post-PCI.
The present study did not find any complications associated with CPET performed one day after PCI. No other studies have been conducted on CPET one day after PCI; hence, the safety results from this study could not be compared to previous research. Exercise loading was stopped at the VAT point and not at the limit of subjective symptoms. Additionally, the included patients had preserved left ventricular ejection fraction and did not show elevated levels of N-terminal prohormone of brain natriuretic peptide. These factors, at least partly, might explain the lack of association with adverse effects during CPET performed one day after PCI. Our findings suggest that CPET can be safely conducted one day after PCI in patients with uncomplicated stable coronary artery disease.
The present study found no clinically significant differences in CPET parameters between the day following PCI and 1–3 weeks post-PCI. To date, no other study has compared CPET parameters across these two-time frames. It is well-established that autonomic function and inflammatory status can influence CPET measurements (Chen et al., 2014; Kasapis and Thompson, 2005; Maciel et al., 1986; Rahimi et al., 2005). Given that coronary lesions are small in relation to the entire body and considering that the PCI is a relatively quick procedure (approximately 45 min) with minimal radiation exposure and a limited amount of contrast medium, it is believed that the procedure’s impact on autonomic function and inflammation is minimal. As a result, PCI does not appear to significantly affect CPET parameters between 1 day and 1–3 weeks post-procedure.
The implications of the present study were as follows: Substantial evidence suggests that ER improves outcomes for patients with coronary artery disease, including those diagnosed with stable angina (Gielen et al., 2001; Hambrecht et al., 2004). Additionally, ER has been shown to effectively improve serum lipid levels and reduce body weight, even in control groups (Tran and Weltman, 1985). Conducting CPET the day after PCI, during hospitalization, allows for an immediate exercise prescription. This eliminates the need for the patient to return for additional testing 1–3 weeks later and facilitates an early start to the ER. Such a prompt approach might further motivate patients to engage in ER.
This study had several limitations: First, the primary focus of this study was to assess the reproducibility of the CPET; therefore, it involved a relatively small number of patients. A power analysis indicated that the sample size was adequate for correlation analysis. Detailed statistical evaluations produced acceptable results, suggesting that an increase in sample size would likely not produce significantly different outcomes. Second, the CPET performed the day after PCI was not symptom-limited, which means parameters obtained at maximal exercise could not be compared between the two sessions. Nonetheless, this may not be a significant limitation as these parameters are not crucial for ET prescription. Third, due to the diverse conditions of the patients, the timing of the 2nd CPET session post-PCI was not consistent. Despite this, our findings demonstrate that the duration of CPET did not correlate with variations in parameters between the sessions nor did it impact linear regression or Bland–Altman plot analyses.
In conclusion, CPET up to VAT is safe the day after PCI. Our results show consistent CPET results between the day after and 1–2 weeks post-PCI. Conducting CPET the next day during hospitalization eliminates the need for follow-up tests, potentially encouraging patients to start ET sooner.