


INTRODUCTION
Strength is the capacity of a muscle or muscle group to produce tension during a voluntary action (Jones and Stratton, 2000). Among the determinants of health-related physical fitness, the strength generated by a muscle group is an important biological predictor of the general health state in early and late stages of life (Hébert et al., 2015; Orsso et al., 2019). As in adulthood and senescence, the decline in muscle mass and strength during the developmental period contributes to adverse health outcomes (Orsso et al., 2019). Several studies have described an increased risk of developing metabolic dysfunction and cardiovascular diseases (Peterson et al., 2016), musculoskeletal injuries (Muehlbauer et al., 2015; Read et al., 2018), and altered neurodevelopment (Delezie and Handschin, 2018) in children and adolescents with low muscle mass and strength. For these reasons, muscle strength assessment is an important clinical measure in pediatric musculoskeletal, cardiovascular, and neurological rehabilitation (Daloia et al., 2018; Eek and Lidman, 2021; Hébert et al., 2015; Muehlbauer et al., 2015).
Muscle strength in children and adolescents can be assessed using isokinetic dynamometry and clinical or field tests (Jones and Stratton, 2000). Nevertheless, some of these methods have limitations for their application in pediatric clinical and research. For instance, isokinetic dynamometry presents severe implementation restrictions because the device is expensive, requires user training, requires additional child-specific mechanical arm segments, and has a poor portability. On the other side, manual muscle testing is a useful ordinal measurement scale for patients who have suffered a considerable loss of strength, but limited by their sensitivity in higher grades (4 and 5) and by the dependence of the force applied by the examiner on the evaluated limb (Bohannon, 2005; Herbison et al., 1996). Since the 80s, hand-held dynamometry (HHD) has been widely used in the clinical research of children and adolescents and has proven to be an easy-to-use method with high reliability, validity and responsiveness for the evaluation of muscular strength of the majority of clinically significant muscle groups (Daloia et al., 2018; Davis et al., 2017; Hébert et al., 2011; Mahony et al., 2009; Schrama et al., 2014; Van den Beld et al., 2006). For these reasons, HHD has emerged as an alternative method that can help assess muscle strength in healthy youth and those with muscle impairments.
HHD can be used to assess the isometric strength of the muscle groups of an isolated joint (Jones and Stratton, 2000). Isometric strength is defined as an increase in tension of the contractile elements without detecting a change in muscle length or joint position (Komi, 1984). HHD can provide the maximum (peak) isometric strength during the performance of a standardized test (Jones and Stratton, 2000; Schrama et al., 2014). Two types of measurement tests are described using HHD (Stratford and Balsor, 1994). An examiner pushes the dynamometer against a subject’s extremity until the subject’s maximal muscular effort is overcome (break test) or keeps the dynamometer stationary while the subject exerts maximum force against it (make test). Various investigations have recommended the use of the make test to obtain reference values of maximum isometric strength, showing greater reliability, validity and responsiveness in the muscle groups of the upper limb (Fieseler et al., 2015; Romero-Franco et al., 2019; Van den Beld et al., 2006). In addition, the make test appears to be more reliable than the break test for hip and elbow strength (Schmidt et al., 2013; Stratford and Balsor, 1994) because performance of the break test may be influenced by the ability of the evaluator to produce the force to try to overcome the strength of the evaluated. Although most upper limb muscles can be evaluated using HHD, the extrinsic and intrinsic hand muscles are often difficult to evaluate by this method in the pediatric and general population. Maximal isometric grip strength, however, is a gross indicator of combined extrinsic and intrinsic hand muscle strength that can be assessed by hand-grip dynamometry (HGD) (Bohannon et al., 2017; McGee et al., 2020; Rauch et al., 2002). In this context, determining maximum isometric strength is important in establishing baseline values in healthy, typically developing children and adolescents (Hébert et al., 2015).
It has been observed that the isometric strength of children is related to age, sex, weight, and height (Hébert et al., 2015; Orsso et al., 2019; Rauch et al., 2002; Schrama et al., 2014). Boys and girls from North America, Latin America, Europe, and Oceania do not show differences in the development of strength until the age of 10 years, but at approximately ages 11–12, boys develop greater strength than girls (Daloia et al., 2018; Escobar et al., 2017; Hébert et al., 2015; McKay et al., 2017). In Chile, Escobar et al. (2017) showed that the difference in strength between boys and girls is observed from the age of 11. However, these observations were measured with the break test using HHD, which gives an approximation of eccentric strength, rather than isometric strength (Jones and Stratton, 2000; Schrama et al., 2014). Knowledge of the isometric strength profile of the upper limb is relevant to assess muscle weakness in neurological and musculoskeletal dysfunctions where the assessment of eccentric strength is difficult and not exempt from injuries (Hébert et al., 2015; Seagraves and Horvat, 1995), especially in dysfunctions that affect upper limb muscles, such as Guillain-Barre syndrome, Duchenne muscular dystrophy, and upper limb fractures, among others (Demir et al., 2020; Lee et al., 2008; Wang et al., 2019). For these reasons, it is relevant to register isometric strength of boys and girls through the make test in order to complement the strength profile of Chilean boys and girls. In addition, children and adolescents with musculoskeletal and neurological dysfunctions often have bilateral impairments, necessitating a “between-subject” comparison muscle group that provides reference values to identify possible muscle weaknesses (Daloia et al., 2018; Eek et al., 2006; Hébert et al., 2015).
For these reasons, the primary objective of the investigation was to determine the isometric strength profile of the upper limb muscles of children and adolescents between 7–15 years of age. The shoulder, elbow and wrist muscle groups were evaluated with HHD using the make test, and the extrinsic and intrinsic hand muscles with HGD. The secondary objectives were to (a) identify the age at which differences in isometric strength are observed between sexes; to (b) determine the age range at which significant progression of isometric strength could be observed in girls and boys; and to (c) identify the role of the isometric strength of each muscle group on the total upper limb strength, adjusted for the variables of sex and age.
MATERIALS AND METHODS
Design
This study featured a cross-sectional design and was reported following the Strengthening the Reporting of Observational Studies in Epidemiology statement (Von Elm et al., 2007). The research complied with all the relevant national regulations and institutional policies, including the Declaration of Helsinki, and was approved by the scientific ethics committee of the Universidad Santo Tomás, Chile (Folio ID-98-19).
Participants
Before participating in the study, all children and their parents were fully informed about the protocol and written informed parental consent and participant assent were obtained. The sample size was calculated based on the largest width of the confidence interval (W) and the largest standard deviation (S) of maximum isometric strength reported in a previous study (Hébert et al., 2015):
where zα′=1.96, S=0.27, and W=0.38. The required sample size was a minimum of seven participants per sex per age group. Children between 7–15 years of age from a school located in the central area of Chile were recruited. All participants presented with typical development, Latino ethnicity, and were Spanish language speakers. Ethnicity was reported following the Standards for the Classification of Federal Data on Race and Ethnicity (White House, 1997). Participants were included if they had intact cognitive function to understand the orders given by the evaluator. Participants were excluded if they presented with (a) pain during investigation procedures (b) a history of medical, neurological, or musculoskeletal impairments that could affect strength measurements, (c) use of medications for pain or musculoskeletal disorders, (d) previous surgeries of the upper extremities and/or spine, or (e) participation in competitive sports during or in the 6 months prior to the study measurements.
Measures
Anthropometric measurements of body mass and height were obtained using a stadiometer (model 220; Seca, Hamburg, Germany) with an accuracy of 0.1 kg and 0.1 cm, respectively. All isometric strength measurements were performed on the dominant upper limb, determined by asking the participants which hand is used to hold a pen and throw a tennis ball. In the case of discrepancies between the test results, participants were asked to indicate their preferred hand. The maximum isometric muscle strengths of the shoulder flexors, shoulder abductors, shoulder medial rotators, shoulder lateral rotators, elbow flexors, elbow extensors, wrist flexors, and wrist extensors were assessed with HHD using a calibrated hand-held dynamometer (MMT 01165, Lafayette Manual Muscle Test System, Lafayette, IN, USA). This device has demonstrated intrarater reliability (intraclass correlation coefficient [ICC]=0.67 to 0.99) and interrater reliability (ICC=0.67 to 0.96) in the reasonable to excellent range in isometric muscle strength tests (Hébert et al., 2011; Macfarlane et al., 2008; Romero-Franco et al., 2019). The order of the muscles tested, the standardized positions, and hand-held dynamometer placement for each muscle group were based on previous reports and are described in Table 1 (Daloia et al., 2018; Escobar et al., 2017; Hébert et al., 2011, 2015). The maximum isometric grip strength of the extrinsic and intrinsic hand muscles was assessed with HGD using a calibrated hand-grip dynamometer (Jamar 5030J1, Sammons Preston Rolyan, Bolingbrook, IL, USA) according to the recommendation of the American Society of Hand Therapists widely used in the scientific literature (Rauch et al., 2002; Rostamzadeh et al., 2021). The handle was adjusted so that the line of the subject’s proximal interphalangeal joints rested exactly on top of the adjustable handle. Participants were seated with their arms by their sides, with elbows flexed 90° (without touching the trunk), forearms in a neutral position, and the wrists held between 0°–30° dorsiflexion and between 0°–15° ulnar deviation (Rauch et al., 2002; Rostamzadeh et al., 2021).
The principal researcher trained the evaluator (a physical therapist) in all dynamometry procedures for twelve hours. Participants wore sport clothes, were barefoot, and all measures were taken during one testing session (1 hr per participant). To assess the maximum isometric strength of the shoulder, elbow and wrist muscle groups, a make test was used. The evaluator kept the dynamometer stationary while the participant exerted maximum strength against it (Jones and Stratton, 2000; Schmidt et al., 2013; Stratford and Balsor, 1994). For all assessments, the participants were asked to perform the maximum isometric strength on the dynamometer (HHD or HGD, as appropriate), while the evaluator encouraged the participants with a standardized phrase, “harder, harder, harder.” For all muscle groups, three attempts were completed, and the peak force (N) was recorded for each one attempt. The average of the three attempts was used for the analysis. Before each muscle group assessment, the participant performed one submaximal contraction. This was performed as a warm-up and to ensure that the task was well understood, and also to ensure that joint stabilization was adequate (Hébert et al., 2015). Each contraction (attempt) was progressive and was held for 5 sec, followed by a 30-sec rest period to minimize fatigue affects. The recorded force (N) of all muscle groups, including the extrinsic and intrinsic hand muscles, was divided by the body mass (kg) of each individual. Isometric muscle strength normalized by body mass was used, since children and adolescents were categorized into narrow age ranges that allow assuming the absence of statistical difference between anthropometric data within a specific age. This ensures that muscle strength data are representative of a given age and sex (Mattiello-Sverzut, 2020). The total upper limb was calculated by adding the normalized maximum isometric strength of the shoulder flexors, shoulder abductors, shoulder medial rotators, shoulder lateral rotators, elbow flexors, elbow extensors, wrist flexors, and wrist extensors.
Statistical analysis
The IBM SPSS Statistics ver. 25.0 (IBM Co., Armonk, NY, USA) was used to perform the statistical analysis of the data. In all tests, an alpha level <0.05 was considered. To determine the isometric strength profile of the upper limb muscles of children and adolescents (primary objective), the mean and standard deviation were calculated for each measurement of maximum isometric strength, grouped by age and sex. Data were considered to be outliers if they were >3 standard deviations from the mean; in these cases, the data was removed. Intrarater reliability was assessed for maximum isometric strength using the standard error of the measurement (SEM) and ICC (two-way random, absolute agreement, average measure). The Shapiro–Wilk test was used to assess the normality distribution of all the data.
To identify the age at which differences in isometric strength are observed between sexes (first secondary objective), a two-factor analysis of variance (ANOVA) (age and sex) was performed for the variable maximum isometric strength of each muscle group and the total upper limb strength. In the case of significant interactions, a post hoc analysis was performed with Bonferroni’s multiple comparison test. To determine the age range at which significant progression of isometric strength could be observed in girls and boys (second secondary objective), the narrowest age range of strength was identified by significant differences (P<0.05) observed between the lowest and highest age of the interval selected. Eta-squared (η2) for ANOVA was used to examine the effect size. A η2 less than 0.06 was classified as “small,” 0.07–0.14 as “moderate,” and greater than 0.14 as “large.” In addition, Cohen d for paired samples was used as an indicator of the effect size. A Cohen d less than 0.2 was classified as “trivial,” 0.2–0.5 as “small,” 0.5–0.8 as “moderate”, and greater than 0.8 as “large” (Cohen, 1992).
Finally, to identify the role of the isometric strength of each muscle group on the total upper limb strength (third secondary objective), the relationship between the maximum isometric strength of each muscle group and the total upper limb strength was analyzed using Pearson test, in which a correlation coefficient (r) from 0–0.4 was considered as weak, 0.41–0.7 as moderate, and 0.71–1.0 as strong. A stepwise multiple linear regression analysis was then performed. The dependent variable was the total upper limb strength, and the independent variables were the maximum isometric strength of each muscle group, adjusted for sex, height, and age. For this method, the independent variable that showed the strongest, simple, significant correlation with the total upper limb strength was initially selected for the analysis. The remaining variables that showed simple significant correlations (from highest to lowest correlation) were consecutively added to this model. The goodness of fit was determined by means of the R2 coefficient and its percentage of change. In addition, collinearity diagnoses were verified through values less than 0.10 tolerance and the identification of the variance inflation factor (VIF), opting to eliminate the variables that showed collinearity with a VIF >10, in order to define the definitive multiple linear regression model.
RESULTS
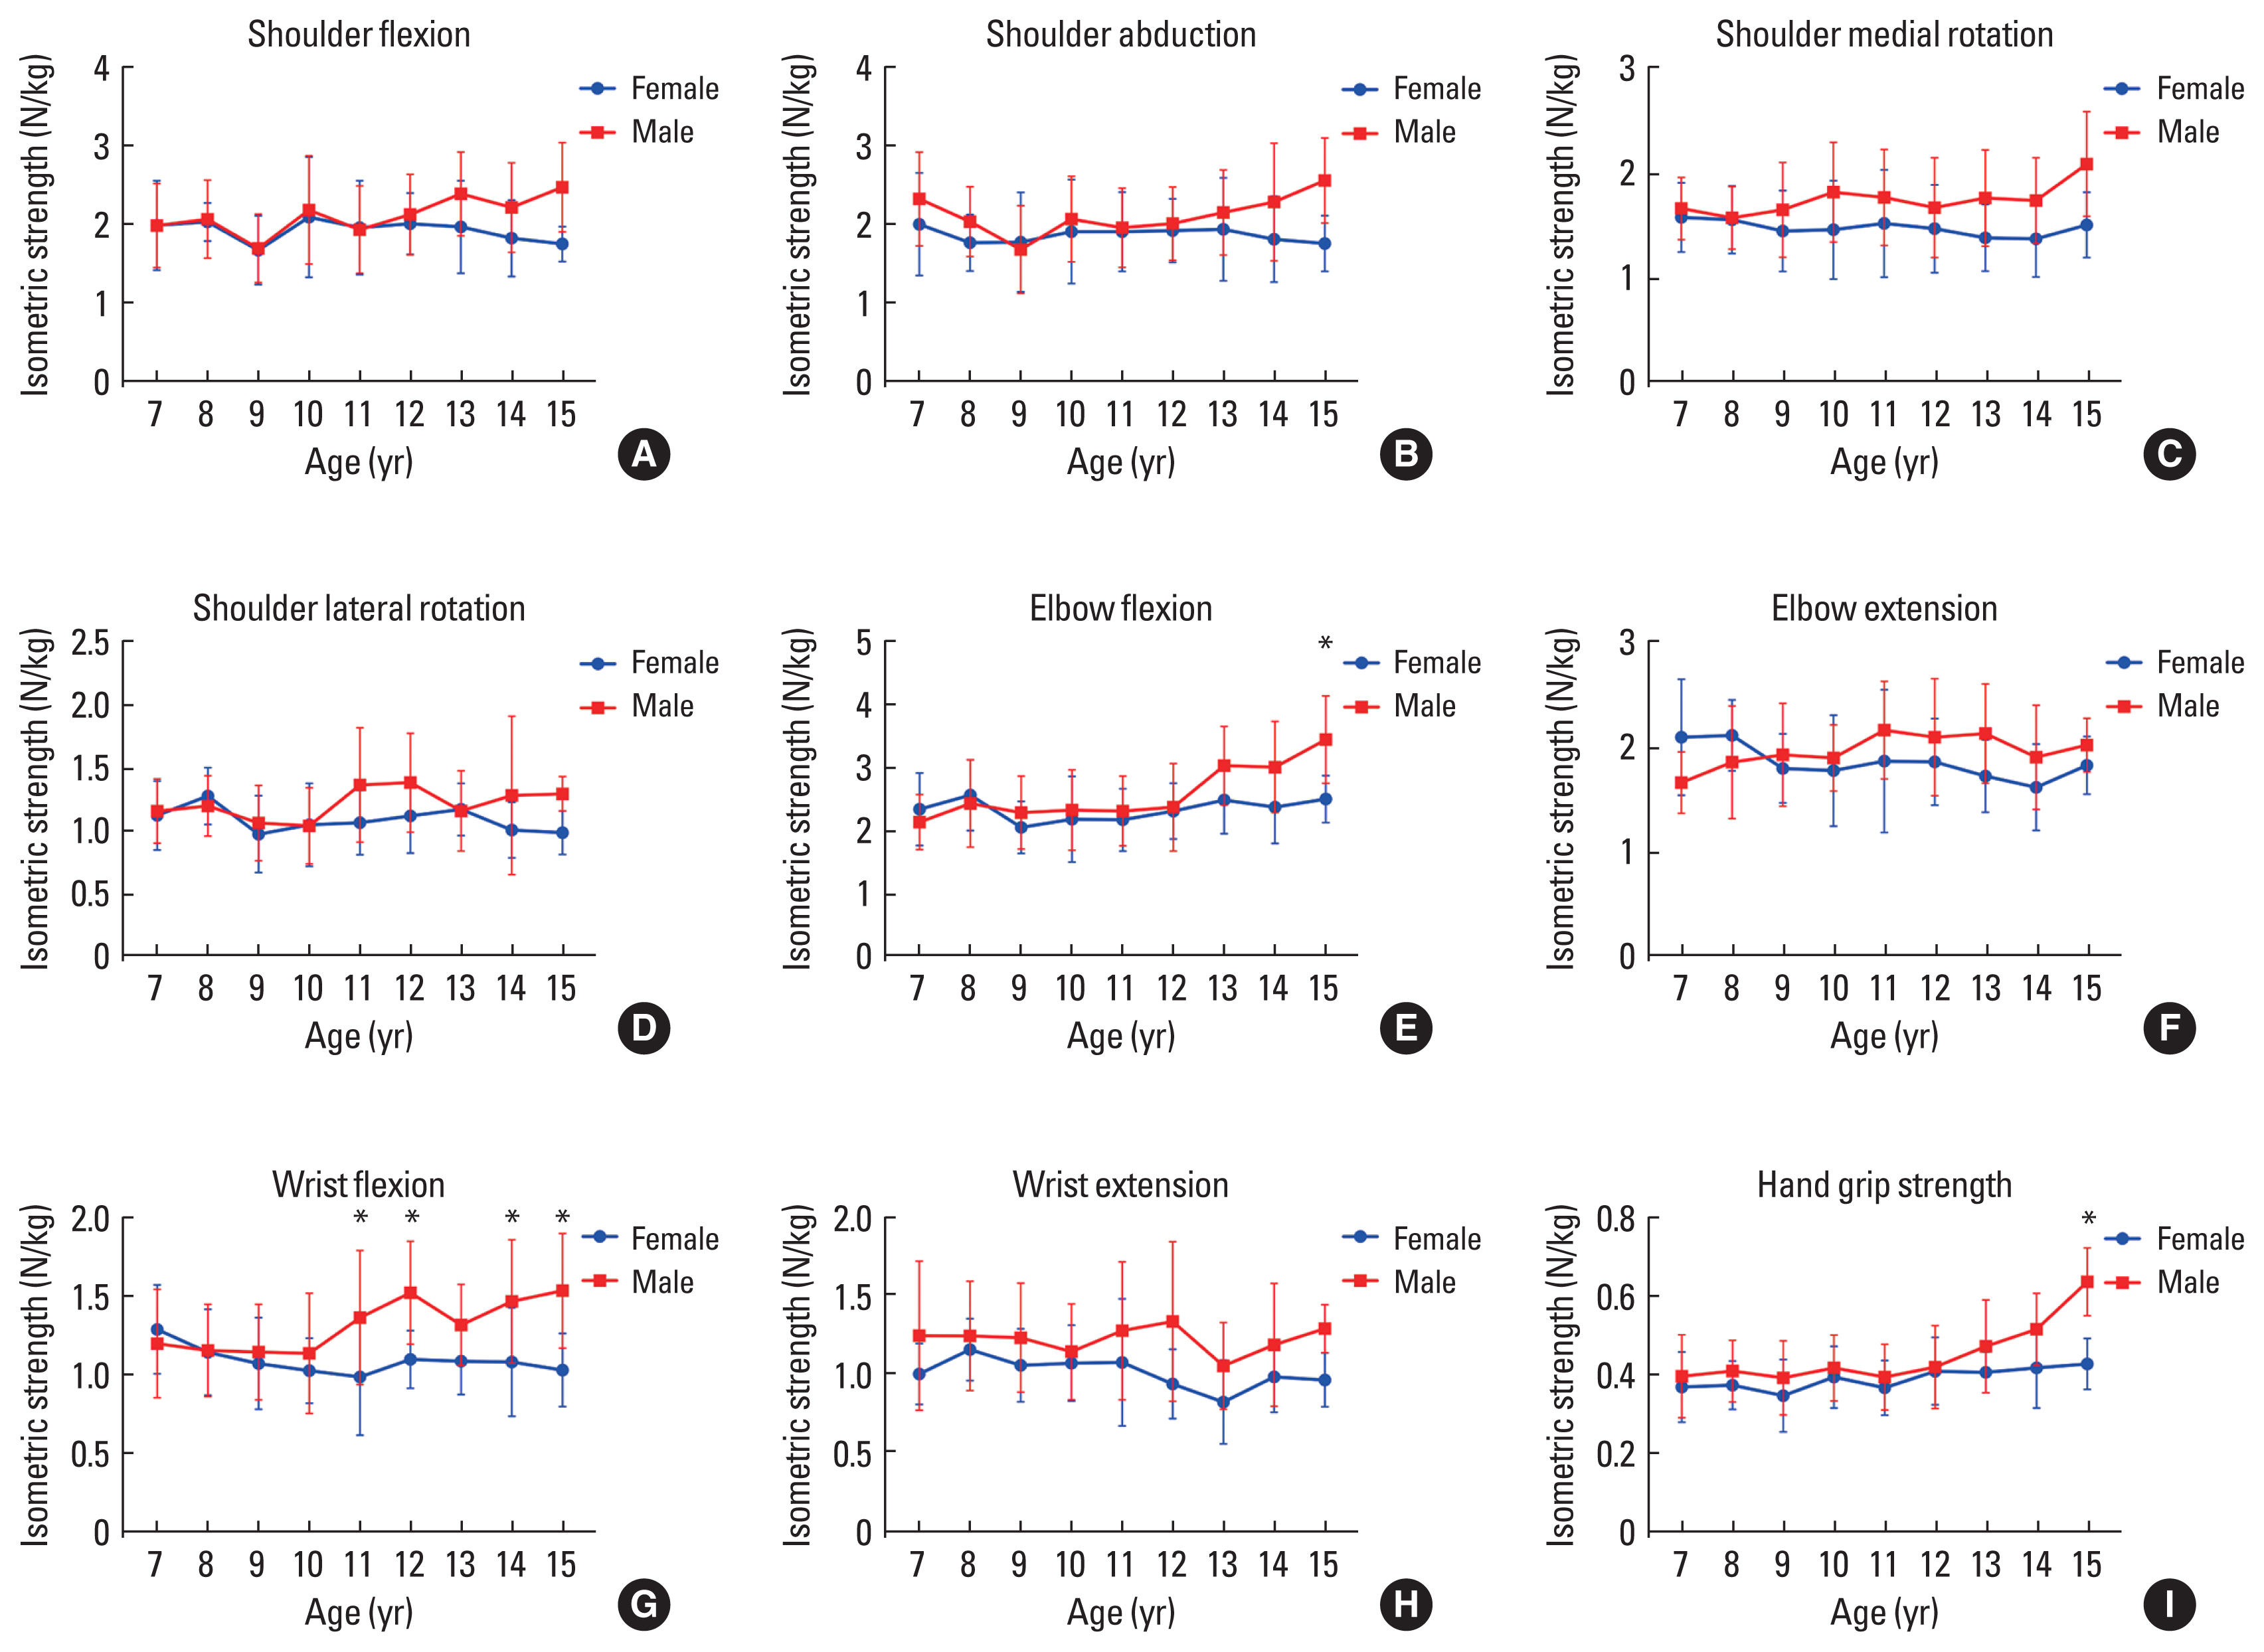
A total of 252 individuals were recruited. Two hundred forty-three individuals (female, n=114; male, n=129) were included in the final analysis. Nine children were excluded: five children who were unable to clearly understand the evaluator’s directions, two children who demonstrated greater strength than the evaluator during shoulder muscle tests, and two outliers (one 8-year-old boy for elbow flexion; one 9-year-old girl for hand-grip strength). Fig. 1 summarizes the maximum isometric strength by means of superimposed symbols (at the mean) for each muscle, age, and sex.
Table 2 shows the total number of participants grouped by age and the average weight, height, and body mass index (BMI) for each group. In addition, the results demonstrated excellent intrarater reliability for maximum isometric strength testing (ICC= 0.79–0.94; SEM=0.04–0.06 N/kg). There were significant differences in height between the boys and girls from ages 13 and higher, but no differences in body mass or BMI were observed for any age group.
Maximum isometric strength data were normally distributed for all muscle groups. The mean and standard deviation for the maximum isometric strength for all muscle groups and ages of both sexes are reported in Table 3 (strength values normalized to body mass in N/kg). The two-way ANOVA reported significant interactions between factors (age×sex) for elbow flexors (degrees of freedom [df]=8, F=2.056, P=0.0412, η2=0.05, small effect), wrist flexors (df=8, F=2.483, P=0.0134, η2=0.07, small effect) and extrinsic and intrinsic hand muscles (df=8, F=2.067, P= 0.0400, η2=0.05, small effect). Multiple comparisons showed significant differences in age and sex. As depicted in Table 3, for the boys, the narrowest age range in the progression of maximum isometric strength were: 10–12 years for wrist flexors (mean difference=−0.38, P=0.0392, d=1.09, large effect), 11–13 years for elbow flexors (mean difference=−0.71, P=0.0074, d=1.23, large effect), and 13–15 years for extrinsic and intrinsic hand muscles (mean difference=−0.16, P=0.0012, d=1.60, large effect). In the girls, no significant differences were observed between those aged 7–15 years in the maximum isometric strength of any muscle group.
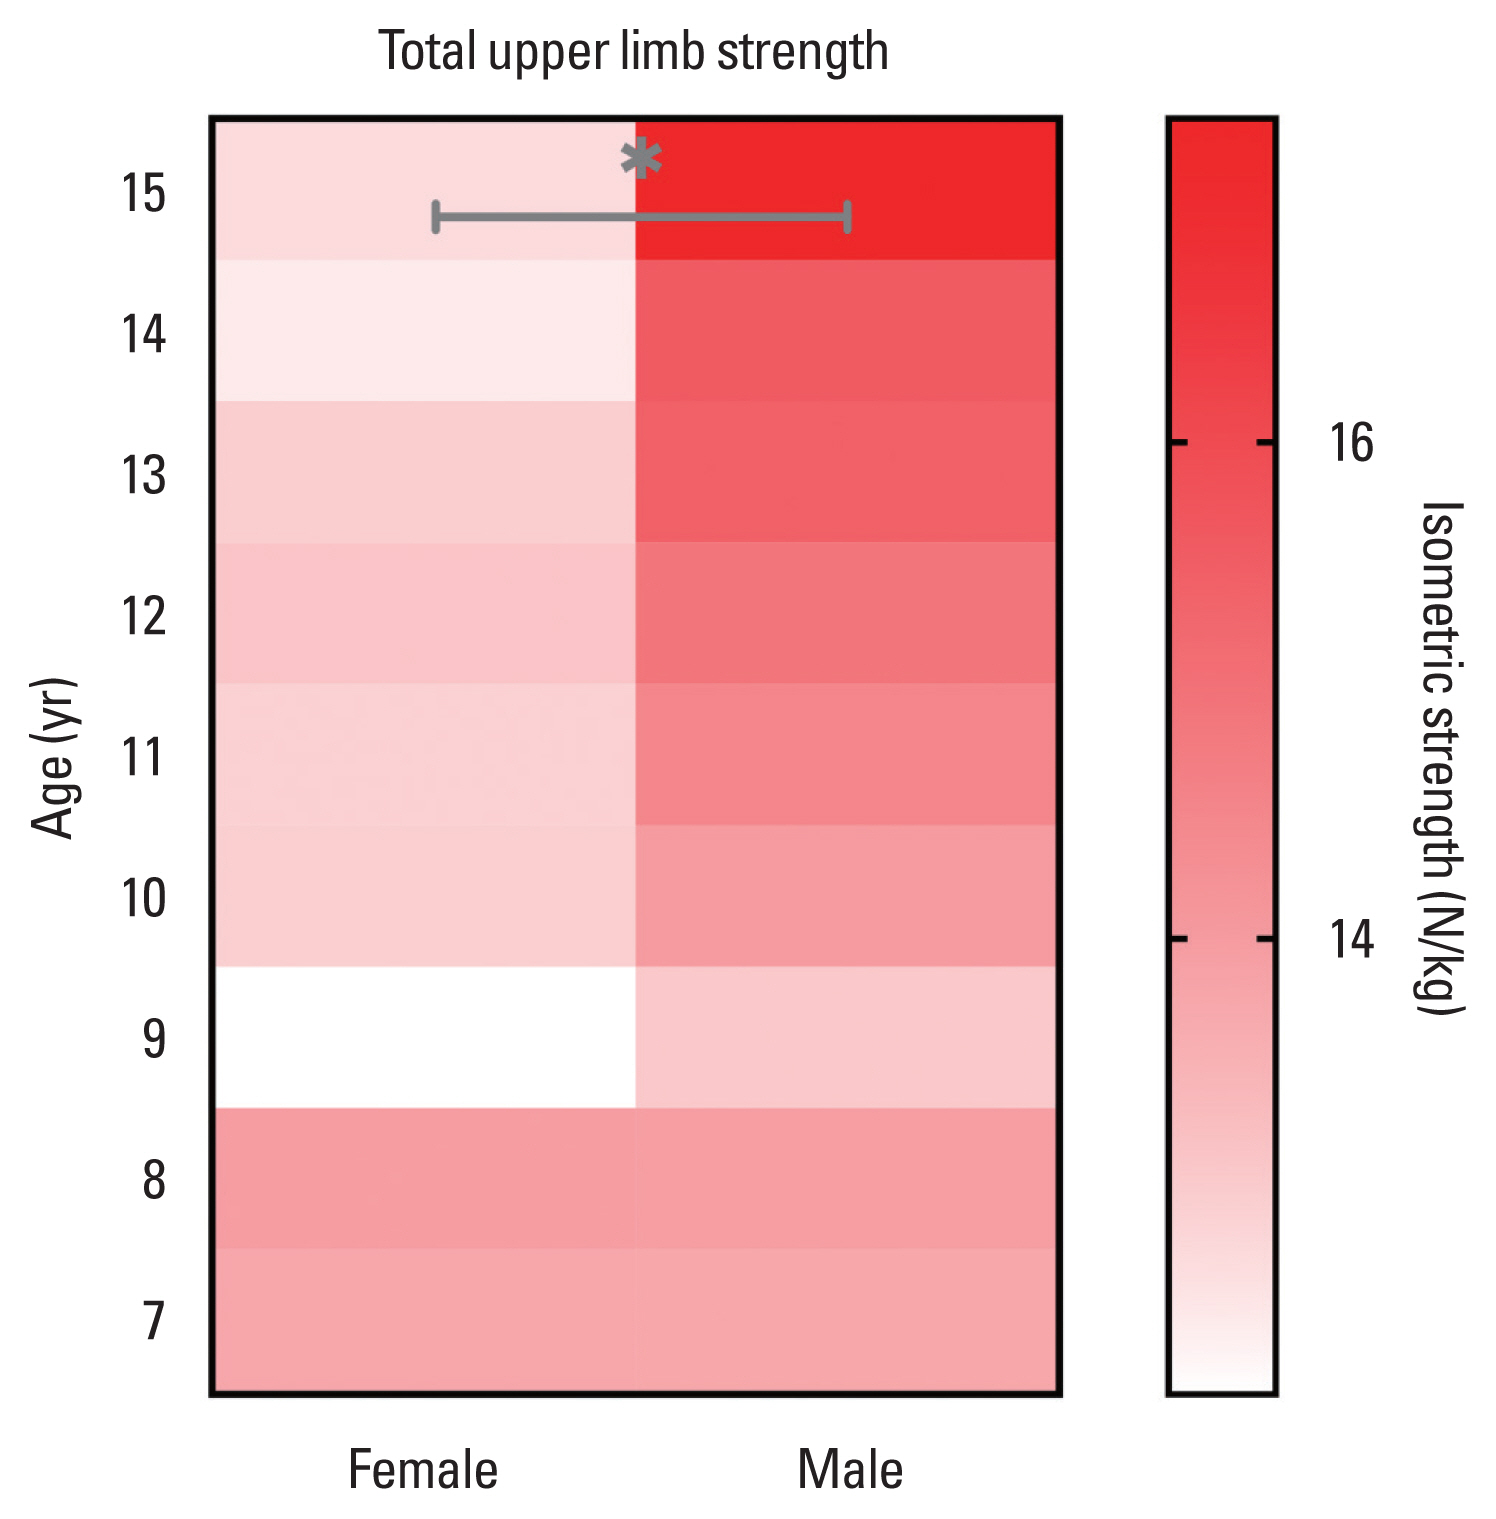
Fig. 1 shows the significant differences in maximum isometric strength between the sexes. From 11 years of age, the wrist flexors were the first muscle group that revealed a significant difference in maximum isometric strength in favor of the boys (P=0.0143, d=0.95, large effect). These differences in maximum isometric strength between the sexes were consolidated at 15 years of age, with the observation of three muscle groups with higher values in boys: elbow flexors (P=0.0268, d=1.70, large effect), wrist flexors (P=0.0250, d=1.69, large effect), and extrinsic and intrinsic hand muscles (P=0.0001, d=2.75, large effect). In this sense, boys showed greater total upper limb strength compared to girls only at 15 years of age (P=0.0269, d=1.97, large effect); Fig 2 shows graphically these differences between sex only at 15 years.
Total upper limb strength showed a moderate to strong significant correlation with all muscle groups (r=0.62–0.86, P=0.001). Conversely, total upper limb strength did not show significant correlation with age (r=0.12, P=0.058) or height (r=0.01, P= 0.919). The stepwise multiple linear regression model (Table 4) revealed that the shoulder flexors, shoulder abductors, shoulder medial rotators, and wrist flexors explained the highest percentage of variance (R2=0.933, P<0.001) in total upper limb strength. Of these, the shoulder flexor group (β=1.12; standard error=0.06; 95% confidence interval, 1.00–1.24) was the main factor that explained the performance of the total upper limb strength (R2= 0.742; P<0.001). The remaining muscle groups explained a change in R2 between 0.004–0.030 points (P<0.001). The sum of age (P=0.288), sex (P=0.236), and height (P=0.356) did not improve the prediction of total upper limb strength.
DISCUSSION
This study presented a profile of upper limb isometric strength by registering nine muscle groups during the development period of boys and girls aged between 7–15 years. These isometric strength values may be used as a complement to the Chilean strength profile obtained in previous research that focused on the eccentric strength of the upper limb using HHD (Escobar et al., 2017). In this way, this isometric strength report may help not only as a “within-subject” comparison tool to assess the development of isometric strength, but also as a “between-subject” comparison tool to assess possible isometric strength deficits in relation to a standard profile of typically developing boys and girls. Our research also revealed that: (a) from 11 years of age, boys begin to present greater isometric strength than girls (wrist flexors), a difference that consolidates at 15 years of age (elbow flexors, wrist flexors, extrinsic-intrinsic hand muscles, and total upper limb strength); (b) in boys, the most progressive development of isometric strength (with significant differences in a narrow range of 2 years) occurred from 10 years of age in the ventral and distal muscles of the upper limb; and (c) the isometric strength of the shoulder flexors, shoulder abductors, shoulder medial rotators, and wrist flexors explained the highest performance of the total upper limb isometric strength.
Isometric strength has been investigated in boys and girls of various populations and ethnicities (Daloia et al., 2018; Eek et al., 2006; Hébert et al., 2015). In Portuguese-speaking Latin American children, the earliest age (10 years) has been reported at which the greatest abrupt change in strength occurs, specifically of the elbow flexor and extensor muscles (Daloia et al., 2018), followed by French-speaking North American children, which this change occurs at 11 years of age, mainly of the shoulder abductor and elbow flexor muscles (Hébert et al., 2015). In the present study, the greatest abrupt change in muscle strength occurs at age 10, with results similar to those mentioned above (Daloia et al., 2018; Hébert et al., 2015); however, this greater progressive development of strength occurred in the ventral and distal muscles of the upper limb. Although there are slight differences between children from different latitudes of the world, previous reports have shown that between 10–11 years is the age interval that is relatively stable between populations, at which the more abrupt age-related changes in the strength progression of the upper limb muscles occurs. The differences reported may be due to variations in the methodologies used to calculate and report muscle force output (Bohannon, 2011; Garcia and Souza, 2020) (i.e., the report of the torque/muscle force per lever arm [Eek et al., 2006; Hébert et al., 2011, 2015] rather than force normalized by body mass [Daloia et al., 2018; Escobar et al., 2017; Van den Beld et al., 2006]). On the other hand, the differences observed may be due to the isometric strength evaluation methods, such as the use of belts for joint stabilization (Eek et al., 2006; Hébert et al., 2011, 2015) or the use of the break test. In addition, this last method has questionable reliability for measuring muscle strength using HHD and the procedure may put children at a higher risk of injuries than a make test (Hébert et al., 2015). For these reasons, we recommend adequately informing the evaluation methodology and reporting results in studies related to maximal muscle isometric strength.
Strength throughout the childhood and youth periods is influenced by the development of lean and fat mass (Baxter-Jones et al., 2005; Corso, 2018; Orsso et al., 2019), maturation of the central nervous system (Hedman et al., 2012), and gonadal steroid hormone concentrations (Soliman et al., 2014); all these factors are strongly influenced by genetic expression (Soliman et al., 2014). These factors are observed during puberty, which explains why girls and boys show a greater change in strength development during the 10–13 years. A pubertal growth spurt, that is, the fast and intense increase in the rate of growth in height and weight that occurs during the adolescent stage (Soliman et al., 2014), take off, on average, at 9–10 years of age in girls and 11–12 years in boys, and have an average peak height velocity of 12 and 14 years, respectively (Committee on the Neurobiological and Socio-behavioral Science of Adolescent Development and Its Applications et al., 2019). For these reasons, the anticipated development of bone length (height) in girls may justify the tendency of higher values of isometric strength in muscles with a greater muscle fiber length, and therefore, a greater lever arm at the joint level, such as the flexors of the elbow, elbow extensors, and wrist flexors (Fig. 1). On the other hand, accelerated growth during puberty is not only experienced by the bone, but also by the muscle (Baxter-Jones et al., 2005; Corso, 2018). In fact, it has been observed that muscle mass experiences greater growth during middle adolescence (12–16 years) in boys and girls (Corso, 2018; Soliman et al., 2014). In this sense, our results on isometric strength, and those of Escobar et al. (2017) on eccentric strength, show that at approximately 11 years of age, the first differences between the sexes are observed, apparently influenced by bone length (height), more than by body mass. However, in the late stage of puberty, fat mass mainly increases in females (Orsso et al., 2020; Soliman et al., 2014), which negatively affects the metabolic and contractile properties of muscle fibers in girls (Orsso et al., 2019) and in this way could partly explain the consolidated differences in muscle strength between the sexes at 15 years (Fig. 2).
To our knowledge, the present investigation is the only study that has evaluated the isometric strength of most of the muscle groups of the upper limb. Previous reports have evaluated the strength of some muscles of the lower and upper limb, and their role in total body strength (Escobar et al., 2017; Hébert et al., 2015), in which it was observed that total body strength is predicted in a higher percentage of variability by the elbow and knee extensor muscles. In our investigation, the shoulder flexors, shoulder abductors, medial shoulder rotators, and wrist flexors explained the higher total upper limb strength performance (R2=0.933). Of these, the shoulder flexors were the muscle group that contributed the greatest proportion (change in R2=0.742) to the prediction model of total upper limb strength; therefore, it can be considered as the target muscle group to be prospectively evaluated in the development of the total upper limb strength in girls and boys, in a simple and abbreviated way.
The present investigation has some limitations. First, the sample was selected for the convenience of a population of children and adolescents from a single school. This did not allow the isometric muscle strength data to be considered as reference values. Second, a sample of public and private schools was not obtained; however, the selected school is considered private/subsidized, which is a category of educational establishments in Chile that is considered to be representative of the population from a socio-economic and cultural point of view. Finally, although the study identified that the sample was mostly Latino and Spanish-speaking, the ethnicity of the participants was not specifically investigated, considering that in Chile, there are a large number of indigenous peoples.
In conclusion, this study determined the isometric strength profile of the upper limb muscles of Chilean children and adolescents between 7–15 years of age. This study illustrated that the most progressive isometric strength development occurred from age 10 years in the ventral and distal muscles of the upper limb, and from this age, boys begin to present a greater isometric strength than girls; a difference that consolidates at 15 years of age. In addition, the isometric strength of the shoulder flexors, shoulder abductors, shoulder medial rotators, and wrist flexors explained the higher total upper limb strength performance. These results may be useful as a “within-subject” comparison tool to assess the development of isometric strength, and as a “between-subject” comparison tool to assess possible isometric strength deficits, especially in bilateral impairments, in relation to a standard profile of typically developing boys and girls.