


INTRODUCTION
Early childhood is known to be an essential period for the development of cognition and health in humans. Children exposed to malnutrition or environmental toxicity are susceptible to diseases (pneumonia, severe infections, etc.) and have a high mortality rate (Heikens et al., 2008; Newton et al., 2008). In developing countries, many children suffer from malnutrition, as measured by stunting, but this problem is often disregarded in those societies. Estimates for 2,000 suggested that 29.8% of the children in developing countries suffered from malnutrition. This malnutrition is also known to have a great influence on mental cognitive ability, and research has reported a strong association between stunting and cognitive performance (e.g., memory disorders, distractibility, and confusion) among children of school-going age (de Onis and Blössner, 2003). For examples, in a study involving 1,674 children in Peru, a significant association was found between stunting and impaired cognitive skills (Crookston et al., 2011). In another study, lack of proper nutrients was found to have affected the normal growth of children who had been malnourished during early childhood (Mendez and Adair, 1999), drawing attention to the recognition and the prevention of early stunting in children in order to improve their cognition. In addition to malnutrition, however, many researchers have reported other factors that might be significantly related to cognitive impairment among children in developing countries; for example, Warsito et al. (2012) analyzed several variables that were thought to have an impact on children’s cognition, including mother’s education, income per capita, mother’s knowledge of good nutrition, participation in early childhood education, psychosocial stimulation, and nutritional status. That no single factor is fully responsible for cognitive development in young children is now a widely accepted premise.
Like many other developing countries, poor nutrition among children is a major problem in Indonesia; In 1999, research on 163,986 children below the age of 5 years in Indonesia revealed that about 28.5% of those children were underweight (Waters et al., 2004). A recent study in Indonesia in 2007 involving 1,311 children with ages from 2 to 5 years reported that 21.4% of the children were underweight and that 36.7% were stunted (Rachmi et al., 2016). In spite of the sustained economic growth and progress in reducing poverty in modern Indonesia, the status of child nutrition continues to remain a critical social issue, especially in socially underprivileged communities; however, other socio-economic factors, including mother’s education, water and sanitation conditions, household poverty, and access to healthcare, also have great impacts on stunting and cognitive development in children.
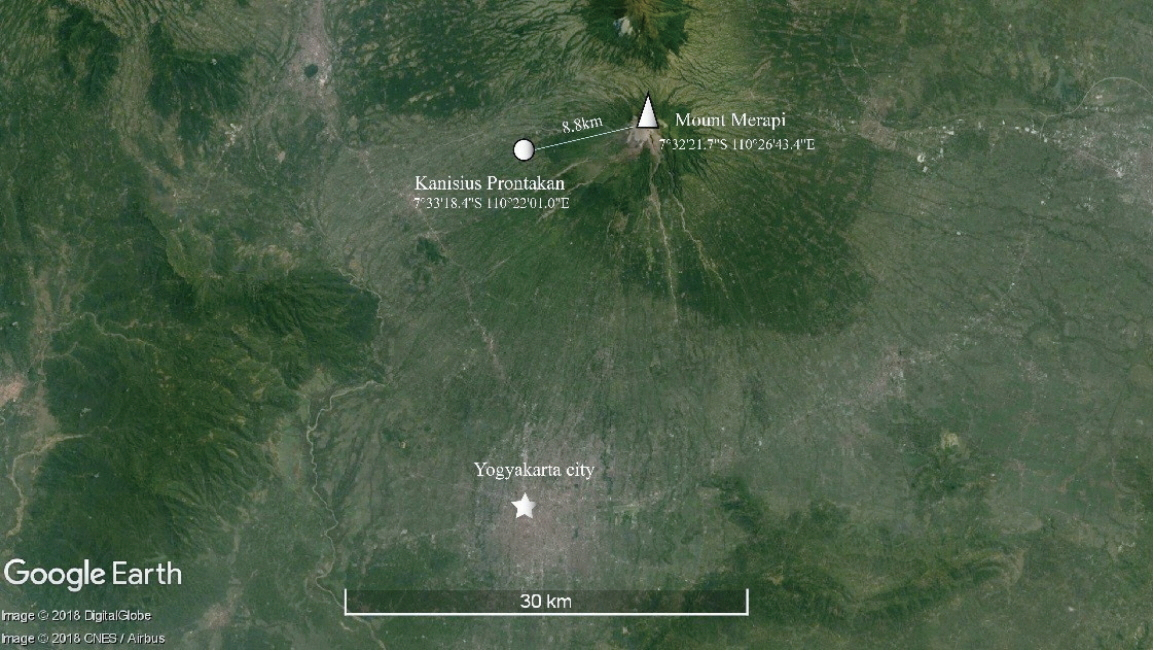
Mount Merapi is a volcanic mountain peak located near the center of the island of Java, Indonesia, about 32 km north of Yogyakarta. It rises to 2,911 meter and has steep slopes with dense vegetation. It is regarded as the most active volcano among Indonesia’s 130 active volcanoes. A series of eruptions of the volcano in 2010, which included pyroclastic flows, which are clouds of superheated gases and incandescent solid particles, caused 141 deaths, 453 injuries, and the evacuation of 278,000 people. The Kanisius is a primary school with 56 students, which, as marked in Fig. 1, is located in Prontakan, the closest village to that volcano, being about 8.8 km from its peak. After its eruption in 2010, the village near the school was fully covered with volcanic rocks and ashes. The inhabitants of this village, which remains one of the most underprivileged communities in Indonesia, have a socially and environmentally difficult life due to frequent volcanic disasters. Indeed, mental cognitive impairment and extreme growth disorders have been identified in the children of this village. This led us to question how the health of the children in the village might have been affected by toxins in the environment due to volcanic activity. Therefore, this research, a case study, sought to contribute to the literature on the impacts of child malnutrition by exploring the relationship between stunting in early childhood and any serious environmental problems; to do this, we observed the mental and physical health problems among the children at the Kanisius primary school.
MATERIALS AND METHODS
This cross-sectional study, which was conducted in 2017, involved 56 students at the Kanisius primary school in Prontakan, Indonesia. Its geographical location is shown in Fig. 1. Our study involved 24 male (42.9%) and 32 female students (57.1%), with ages ranging from 7 to 14 years. All students who were enrolled at the Kanisius school when this study took place were eligible to be included in this research. Of the eligible students, those who had high rates of absences or who had declined inclusion in the research were excluded.
Height and weight were measured using a standing meter stick and a medical scale, respectively. The body mass index (BMI) for age and the height for age of 56 students were calculated and categorized by using the Z-score according to World Health Organization (WHO) growth reference data for children and adolescents 5–19 years of age (de Onis and Blössner, 2003). Weight for age data was obtained for only 44 students. This indicator does not apply to students entering puberty, because the increase in body weight is not necessarily related to height (World Health Organization [WHO], 2009).
To evaluate the cognitive ability of the student, we used the intelligence quotient (IQ) score as an indicator. We compared students’ performance on a standardized IQ test by converting their performances into percentiles or into a score using a normative average of 100 with a standard deviation (SD) of 15. In our study, IQ scores were categorized by using Raven’s Colored Progressive Matrices (RCPM) (Raven, 1986). Raw scores from the individual Raven’s tests were adjusted by age into percentile according to the RCPM manual and were categorized as follow (Raven et al., 1998):
Intellectually superior: ≥95th percentile for children of that age group,
Above average in intellectual capacity: ≥75th and <95th percentile for that age group,
Intellectually average: ≥25th and <75th percentile for that age group,
Below average in intellectual capacity: ≥5th and <25th percentile for that age group,
Intellectually impaired: <5th percentile for that age group.
A questionnaire was designed to collect information regarding family history, source of drinking water, and factors associated with the parent’s occupation. Parent or family members (older than 18 years of age) who were living in the same house with the students were invited to the school. Questionnaires were completed based on the instructions and/or direct interviews given by well-trained interviewers fluent in Indonesia. All of the people who provided information for this study gave verbal informed consent; in many cases, written consent could not be obtained due to the high rate of illiteracy among the interviewees.
Drinking water was sampled at three different sites. Sample one was taken from the river near the school, which was said to be the most common source of water for the villagers, sample two was taken from the water source at the school where the students were studying, and sample three was from the church near the school. Drinking water samples from those sites were analyzed for 13 chemicals that have been reported to be related to health when absorbed in large amounts. The amount of each element was measure in ng/mL, and the results were compared with the standards for drinking water published by the WHO, Geneva, 1993 (mg/L) (WHO, 2017a). All samples were collected using new, sterilized plastic containers, after which they were taken to Korea, where they were analyzed using atomic absorption spectrometry to quantify the concentration of each of the 13 elements in the water samples. An inductively coupled plasma - mass spectrometer (NexION 300 ICP-MS, PerkinElmer Inc., Hopkinton, MA, USA) and an inductively coupled plasma - optical emission spectrometer (Optima 8300 ICP-OES, PerkinElmer Inc.) were used for the measurements.
IBM SPSS Statistics ver. 22.0 (IBM Co., Armonk, NY, USA) was used for data entry and data analysis. Due to small sample size (n=56), Fisher exact test was employed to examine the significance of the association between the different classifications. The nutrition status and the Z-score were determined using WHO AnthroPlus software (V1.0.4 for personal computers), which was developed to assess the growth of the world’s children and adolescents. A P-value less than 0.05 was used as the cutoff for significance.
RESULTS
Characteristics of the studied population
In 2017, this school had more female (57.1%) than male students (42.9%) (Fig. 2A). Students in grades 3 and 4 made up 50% (28 students put of a total of 56) of the study sample whereas the numbers of students in grade 5 and 6 were relatively small (Fig. 2B). For parents’ occupation, farming was the most prevalent, with 53.6% and 58.9% of the fathers and the mothers, respectively, being involved in that vocation; 19.6% and 25% of the fathers and the mothers, respectively, reported working as laborers. We noted that the villagers often held several jobs at the same time to earn a living; for example, while they were farming, many of them also collected black sand and volcanic rocks for construction. Only about 10% of the mothers stayed at home as housewives. A local stream nearby (Nangdong) provided water to one-third of the people in the study; however, many people interviewed stated that they used more than one source of water for daily life (Table 1).
IQ scores and related factors
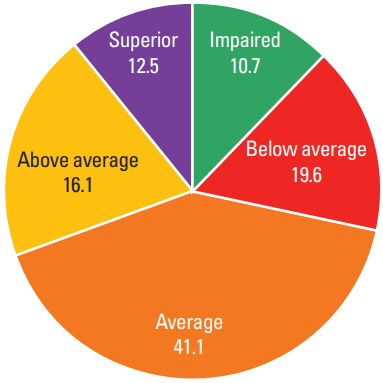
Our IQ results revealed that 19.6% of the students were below average intelligence and that 10.7% were intellectually impaired (Fig. 3). Several factors that might have been the causes of this cognitive impairment, such as family psychiatric and goiter history, birth history, infection during pregnancy, head trauma, and main source of drinking water, were investigated. Among the 56 children, 14.3% were born with the use of a C-section or vacuum or forceps, which are common risk factors for head trauma during birth (Table 2). Of the students, 8.9% had a parent or a sibling with a psychiatric disorder according to the perception of the interviewed person, and 5.3% had at least one family member with visible goiter. Especially, signs of maternal infection were very common, accounting for 60.7% of the 56 recorded cases of infections. Moreover, 69.6% of the children had been infected with bronchitis at least once in their lives and/or with measles, mumps, or chicken pox. However, Fisher exact test showed no statistical difference of IQ scores among the groups (Table 2).
As can be seen, students in grades 1–2 and 5–6 showed higher proportions of impaired intelligence (5.4% in both groups) than students in grades 3–4 (P<0.05) (Table 2). Additionally, 96.4% of the students were shorter than the WHO’s standard for children and adolescents aged 5–19. About 14.3% of the students aged 6–10 years were underweight (<−2 SD). The overwhelming shortness among the students caused both the BMI for age and the weight-to-height ratio to be very high (Table 3).
Because chemical exposure could be a cause of low IQ and stunting, we collected and analyzed water samples taken from three sources of water in the region to determine if the low IQ and stunting might be related to contaminants in the drinking water. The analysis showed that the concentrations of all the chemicals detected in the water samples from the three sources fell within the safe range as defined by the WHO (Table 4). Calcium and magnesium seemed to be high, but the WHO provides no guidelines for these chemicals because their effects on human health have not been recorded (Rapant et al., 2017).
DISCUSSION
Our report reveals that a significantly high number of students in the underdeveloped region of Prontakan in Indonesia are suffering from intellectual impairment. The IQ for Indonesia was estimated to be approximately 87 in the 2010 data of Lynn and Meisenberg (2010). Other research on primary school students (6 to 10 years of age) in Bali, Indonesia, reported an average IQ of 84 (Rindermann and te Nijenhuis, 2012). Such IQ data show that the average IQ of an Indonesian child is, in general, lower than that of children in many other Asian countries, such as Korea, Vietnam and China (Lynn and Meisenberg, 2010).
Environmental exposure to toxins, for example, mercury and lead, has been reported to increase the risk of IQ impairment. Moreover, the eruption of Mt. Merapi in 2010 led to the formation of a number of environmental chemicals that potentially could affect the health and mental development of the children in this area (Hlodversdottir et al., 2016; Zeballos et al., 1996). Most of these toxins accumulate in soil and are then transferred to food and water (Liu et al., 2010). For that reason, we determined the concentrations of several chemicals in samples taken from the main sources of drinking water for the villagers. However, no chemicals were found to have levels higher than the standards for drinking water provided by the WHO (WHO, 2017b). In addition to investigation of the drinking water, we also collected and analyzed data on other factors that might have affected the children’s cognition, such as medical and trauma history, goiter, nutritional status, and the family member with a psychiatric disorder. We found that the mothers of more than half of the children in this area might have had an infection during the prenatal period. In fact, their mothers had experienced symptoms such as fever, diarrhea or swollen glands when they were pregnant; this indicates that those mothers might have had a viral or bacterial infection during pregnancy. Whether or not the babies presented with symptoms of infection, such as jaundice, fever, coughing poor appetite, etc., could not be determined due to lack of awareness of the mothers. Nevertheless, congenital infection might have severe consequences, including cognitive impairment (Cannon, 2009). This is an important finding because a study on the nutritional status of Indonesian infants showed that prenatal factors had more impact on their growth than postnatal events (Schmidt et al., 2002). These observations might result from poor healthcare and poor sanitation systems, low awareness of residents about possible factors that affect their health, and especially the alarming environmental situation in this area near an active volcano. Although no significant relationship between the above factors and the development of cognition in the investigated children was observed, literature reviews provide strong evidence that the simultaneous effects of different factors might have a great impact (Dickerson and Popli, 2016).
From our investigation, we found an excessively high rate of stunting among the students, with most of them being severely stunted, which has never been observed in other regions in Indonesia (Chirande et al., 2015; de Onis and Blössner, 2003; Dearden et al., 2017; Tiwari et al., 2014; WHO, 2017b). For example, in a study involving 1,366 children from three districts in the country, the incidences of stunting and severe stunting were 28.4% and 6.7%, respectively, which are much lower than our observations in Pronkatan (Torlesse et al., 2016). Another study in 2009 that assessed the proportion and the determinants of stunting and severe stunting among 0- to 5-year-old children in North Maluku Province reported 29% incidence of stunted children (Ramli et al., 2009). Similarly, in a previous study in the Village of Babakan, West Java, the data on nutritional status revealed that a total of 24.1% of the children were underweight and wasted and that 19% were stunted or severely stunted (Warsito et al., 2012). These results highlight that malnutrition, both before and after birth, greatly influences the intelligence of school-age children (Li et al., 2016). The prevalence of stunting among students at the Kanisius primary school was very high compared with the values published in many other reports on rural areas around Indonesia (Torlesse et al., 2016; Warsito et al., 2012), stunting in childhood is known to lead to a higher risk of obesity in later life, which is a double burden in many countries (Tzioumis and Adair, 2014). This can be seen in our results, where many students had elevated weights, but smaller heights, resulting in the BMI for age being >2 SD. Thus, although our results found insignificant differences of IQ between the stunted group and the other groups, the early and prolonged effects of malnutrition might be contributing to the high prevalence of below-average IQ in the studied community.
Note that the present study has some limitations. Due to the overwhelming proportion of stunting and the small population that could be included in the research, conditions were not favorable for statistically observing the relationship between nutritional status and the IQ of the students in this region. Moreover, getting information from the parents was difficult owing to their low awareness of personal healthcare. Information on medical and trauma history was also limited as most families did not use medical services for nonsevere diseases. The language barrier was another difficulty when trying to design a more detailed questionnaire. Because the area of our study is dangerously near an active volcano that had erupted seven years earlier, many people may have migrated in and out of this region, which may have had an impact on the prevalence of health problems that we noted.
In summary, from our field research, we found significantly high rates of intellectual impairment and stunting among students in the Kanisius primary school at Prontakan. Although the prevalence of these health problems was high, no direct causes could be found in this research. Furthermore, from among many socio-economic factors, such as family psychiatric and goiter history, birth history, infection during pregnancy, head trauma, and main source of drinking water, we were unable to associate any of these factors with the health problems. Nevertheless, the results from our study should provide valuable information for use in local health promotion programs and for further studies evaluating the effects of volcanoes on the health of the residents in the surrounding communities.