


INTRODUCTION
Worldwide overland transport business requires several millions of an employee, most of whom consist of male truck driver (van der Beek, 2012). Tasks of cargo truck is to drive for distribution of various cargos, therefore the continuous observation of traffic situation and locomotion due to tight schedule of distribution etc. results in an increase of mental fatigue by overwork load (van der Beek, 2012).
In addition to fatigue of truck drivers, they were always exposed to lumbar back pain and disorder with excessive vibration against whole body (Bovenzi et al., 2006; Seidel, 1993), epidemiology of which showed more cases of disorder of back pain and handicap of vertebrae disk in exposed group to vibration than as was not (Bovenzi and Hulshof, 1999; Hulshof and van Zanten, 1987). Also Andrusaitis et al. (2006) reported that 249 of 489 (59%) truck driver experienced various the back pain of vertebrae.
That is, truck driver encountering the several dangerous factors due to long-time driving steps down ordinarily not only in a condition of increased pain of muscular skeletal part of waist, neck, shoulder ect. (Hedberg, 1985; Krause et al., 1997; Rossignol et al., 2003; van der Beek et al., 1993), but also of lowered level of sensibility and motor ability. Because of truck’s higher seat height made for cargo transportation in contrast to other vehicles, most drivers during up and downward stepping must be ready to suffer the falling accident both inconvenience and falling risk simultaneously (Hyun and Ryew, 2017). Ryew and Hyun (2013) of preceded study related with downward stepping on bus stair reported that 27.00±1.32 cm of 1st stair, 26.50±2.17 cm of 2nd stair, and 37.66±0.28 cm of 3rd stair height respectively, the 3rd stair height of which was too high and very inconvenient as of 3.70 N/BW of peak vertical force (PVF) in descending.
Particularly it was reported that wrong downward stepping may increase an injury risk at knee joint due to situation of interrupted-visual information during the nighttime by irregular driving schedule (Coggon et al., 2000; Maetzel et al., 1997; Sandmark et al., 2000). Visual information at landing provides preliminary confirming of spatial information against landing point and controls preparatory role of joint and muscle activity to absorb an impulse force at landing (Sidaway et al., 1989), but interrupted visual information of the height against landing point results in reduced stability according to increase of ground reaction force (GRF) in x–y axis, loading rate and PVF (Koh et al., 2011). Therefore injury risk on muscular-skeletal system may be increased when did not absorb an impulse force occurring at landing of foot (Nigg et al., 1987). In spite of subsidiary hand rail attached to exit door to resolve an inconvenience, most driver prefers to jump directly from seat (Fathallah and Cotnam, 2000). It is necessary quantitative materials for predicts and prevents the risk possibility of injury during landing from cargo truck.
That is, the aim of the study was to compare and analyze the kinetic variables during downward foot-on according to the foothold heights under interrupted-visual information on 25-t cargo truck.
MATERIALS AND METHODS
Subject
Skilled adult male drivers (n=10; mean year, 29.3±6.18 years; mean heights, 177.78±2.30 cm; mean weights, 76.17±2.34 kg) engaged in cargo truck driving over 1 year participated in the experiment. Experimental design for this was reviewed and approved from Bioethics Committee of Jeju National University (JJNU-IRB-2016-024-001) and all of whom understood and consented on the purpose and details of the study.
Experimental procedure
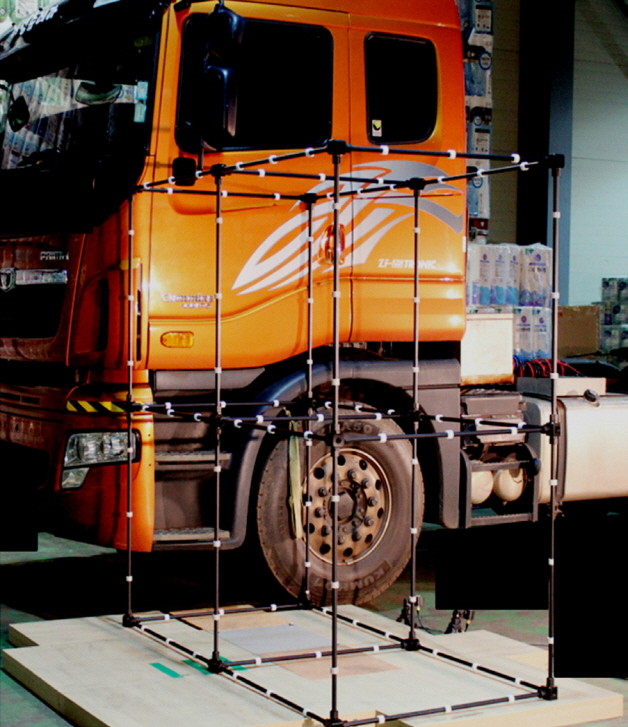
After 25-t cargo truck owner’s consents, the truck made of 3 footholds for downward stepping was set up within indoor truck house with three-dimensional cinematography and GRF (AMTI-OR-7, Advanced Mechanical Technology Inc., Watertown, MA, USA) equipments under lateral side of driver seat. Height difference of between GRF plate and ground surface was adjusted on wheel and leveled with wooden box similar to height of GRF plate (Fig. 1). Then GRF (1 ea) data was collected at sample rate at 1,000 Hz, similar wooden box was installed widely to reduce data errors occurring by stepping anxiety due to narrowed landing area.
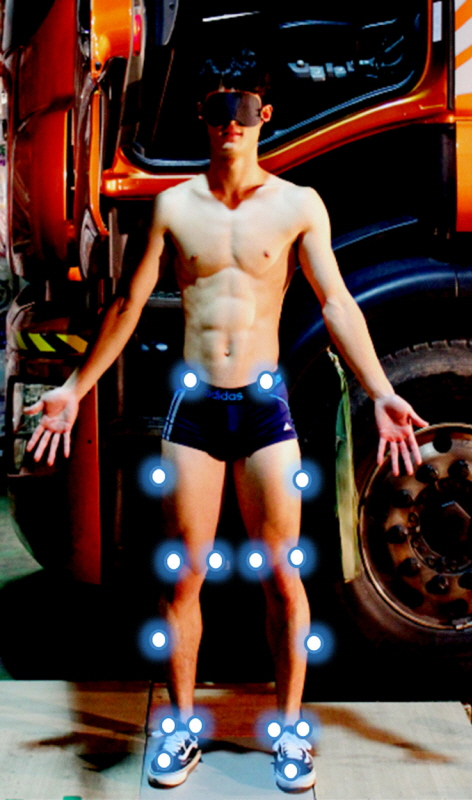
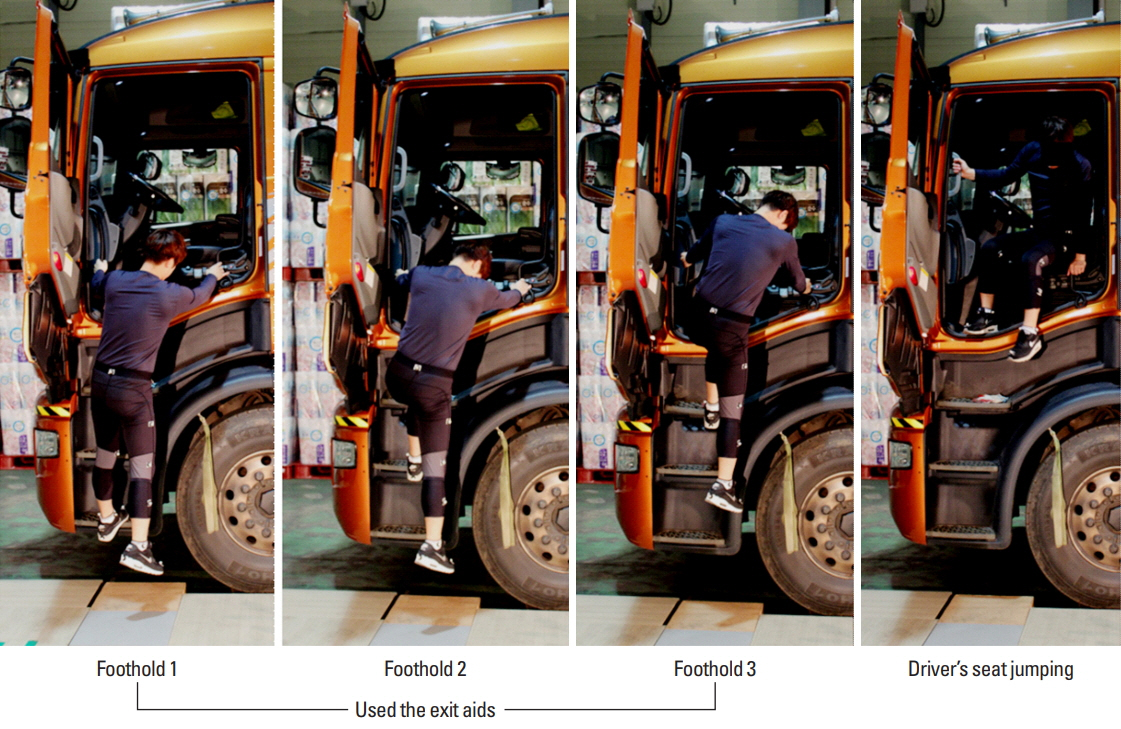
The 4 ea Camcorder camera (HDR/HDV 1980i, Sony Corp, Tokyo, Japan) and its light facility were installed within controlled spatial range which can capture an entire downward stepping motion, and set up at 60 frame/sec of camera speed and 1/500 sec of exposure time respectively. Body segment parameter (Plagenhoef et al., 1983) to calculate center of mass and velocity of whole body and total 19 digitizing points on body were applied to lower extremities model of the study (Fig. 2). The experiment was performed in order of the total 4 types of utilization of handrail on the 1st (1), 2nd (2), 3rd (3) stair according to whether secured or interrupted of visual information and jumping from driver’s seat directly (4) (1 subject: 2×4 trials) (Fig. 3).
Experimental procedure was measured the same trial repeatedly during the daytime in case of secured-visual information and the nighttime in case of interrupted-visual information respectively. Then at the nighttime, all subjects wore an eye-patch additionally for complete interrupted visual information from camera’s light facility. On the basis of that impulse force increased according to height’s increase between foot and ground surface during downward stepping of bus (Hyun and Ryew, 2014), The distance between truck and GRF plate was fixed on one’s preferred distance through preliminary practice.
Definition of analysis phase
Dimensionless model of leg stiffness was known as proper criterion on the motion evaluation in a situation of an increasing movement of leg’s length in human activities, which stiffness variables was made up the vertical GRF force (normalized body weight) and change rate (%) of leg length and was evaluated in a way of ignoring the unit of two variables (Sider et al., 2015).
is defined as normalized value divided PVF with body weight, also
Fmax is normalized value of change rate (%) of leg length, lo is shortest length of leg at ground landing as an estimate of leg length, then leg length delivered from COP to center of gravity (COG) of pelvic was cited from muscular-skeletal system model (Delp et al., 1990).
Analysis and process of data
The average and the standard deviation of the calculated variables were obtained using IBM SPSS Statistics ver. 21.0 (IBM Co., Armonk, NY, USA), performed repeated measures two-way analysis of variance according to interrupted visual information and foothold heights and performed the post hoc test (Duncan) at (P<0.05) in case of significant level respectively.
RESULTS
The results from kinetic variables and stiffness of lower leg according to interrupted-visual information (1st, 2nd, and 3rd stair) and foothold heights from cargo truck was as (Table 1). Kinetic variables and stiffness of lower leg according to interrupted-visual information (1st, 2nd, and 3rd stair) and foothold heights showed significant difference (P<0.001), followed in order of driver seat>3rd>2nd>1st stair. Also PVF and loading rate showed the same results, followed in order of driver seat>3rd>1st, 2nd stair at PVF, and driver seat>3rd>1st stair (P<0.05) respectively.
The results from COP according to interrupted-visual information (1st, 2nd, and 3rd stair) and foothold heights from cargo truck was as (Table 2). Medial lateral (ML)-COP, anterior posterior (AP)-COP, and COP area according to interrupted-visual information (1st, 2nd, and 3rd stair) did not showed significant difference (P>0.05), but and foothold heights showed significant level (P<0.05), and followed in order of driver seat>3rd>1st stair of ML-COP, driver seat>1st, 2nd, 3rd stair of AP-COP, and driver seat>3rd, 2nd>1st of COP area respectively.
The results from stiffness of leg and kinetic variables according to interrupted-visual information (1st, 2nd, and 3rd stair) and foothold heights from cargo truck was as (Table 3). Medial lateral stability index (MLSI), APSI, vertical (V)SI, and dynamic postural stability index (DPSI) showed significant difference (P>0.05), and followed in order of driver seat>3rd>1st stair of MLSI, APSI, VSI, and DPSI, but driver, 3rd>1st, 2nd (P<0.05) respectively.
DISCUSSION
There is nowadays many types of information and model on exercise prescription and rehabilitation diagnosis for vibration exposure and back pain of body resulted from long time driving. Clear diagnosis and prescription are very important to maximize the effectiveness of exercise rehabilitation depending on the type of injury in truck driver (Hyun and Ryew, 2017). But causes and effects and quantitative materials between impact types and injury occurrence is still not enough in spite of higher injury possibility and fatal wound during downward stepping from cargo truck.
Spring-mass model defined lower leg of body as linear spring without no mass, and it had close relationship with change rate of leg length during supporting phase and PVF (Farley et al., 1993). It was reported that stiffness of lower leg showed rather difference in line with ground conditions on which foot contacts, and it was in inverse proportion to stiffness of surface touched during exercise (Alexander, 1989; Feehery, 1986). Therefore some level of stiffness should be maintained for the fittest performance of human movement (Arampatzis et al., 1999; Dutto and Smith, 2002; Kerdok et al., 2002; Kuitunen et al., 2002; McMahon and Cheng, 1990; Seyfarth et al., 2002; Stefanyshyn and Nigg, 1998), but it may be failed to control of leg stiffness by rapid change of PVF and length of lower leg during jumping or downward stepping from vertical height of driver’s seat to solid surface.
That is, downward stepping from 1st stair of truck with noninterrupted visual information showed similar value with 35 (dimensionless) of stiffness value during running, proportional increasing trend of 2nd and 3rd, and showed about 2 times of 44 (dimensionless) of added body weight (30%) during running in case of downward stepping from driver seat (Silder et al., 2015). Also PVF and loading rate showed significant increase according to foothold height, and showed similar pattern with leg stiffness in the study.
Particularly leg stiffness, PVF, and loading rate showed larger increased pattern in interrupted-visual information than was not case. These result partly coincided with report of Santello et al. (2001) which could not be controlled and shown the more variability of impulse force in case of interrupted-visual information and be controlled the consistent performance of movement during landing. Loading rate is value of PVF divided by applied time, which means elapsed time to PVF point by body weight (Diss, 2001), and high loading rate means not only limited absorption of impulse at landing but also pressure of stress against lower leg for a short time (Hargrave et al., 2003). Also because leg stiffness is closely related with PVF and change rate of lower leg (%) (Donelan and Kram, 2000; Farley and González, 1996; McMahon and Cheng, 1990), increased lower leg’s stiffness means a degree of stiffness and rigidity of lower leg.
Therefore the more flexed type of knee joint during locomotion may reduce impulse force, vertical stiffness, impact absorption, impulse force transferred to skull (Hewett et al., 1999; McMahon et al., 1987; McNitt-Gray, 1993), but in case of downward stepping motion from high foothold height of cargo truck, an impact absorption mechanism may be neglected unconsciously. Particularly visual information may make preparation for activities of joint and muscle to absorb an impact occurring at landing by preliminary recognition on spatial distance against landing point (Santello et al., 2001; Sidaway et al., 1989), but interrupted-visual information may take a mechanism to limit the movement of ankle in the course of securing of stability (Kuo, 1995; Kuo and Zajac, 1993). In that the former mechanism can adopt manageable strategy prior to ground landing in various impact situations (Santello et al., 2001), interrupted-visual information on the foothold heights during downward foot-on from cargo truck enables to increase the leg stiffness, PVF, and loading rate for continuous supplementation of deficit feedback on visual information.
COP variables as stability index in the study was defined as the center of action of GRF vector occurring alongside with rectangular coordinates (two-dimensional [ML, AP]) against horizontal plane and was evaluated in unit of time-serial function (Kapteyn et al., 1983). That is, it did not showed difference in case of interrupted visual information, but showed increasing trend according to truck’s foothold heights. COP area integrated by ML-COP and AP-COP showed increasing trend due to increase of the moved trace of COP on the direction of ML and AP for posture control after landing according to truck’s foothold heights. The stability index by DPSI method (Maximum force on 3 direction GRF [ML, AP, and V] divided by elapsed time) which can be evaluated in dynamic situation meant improved higher stability index when coming to close to 0 value in each direction, but the higher index value meant lowering stability index (Wikstrom et al., 2005). Decrease of stability meant the type occurring stronger impulse force during shorter time than that of landing of foot. MLSI, APSI, VSI, and DPSI of the study showed the higher foothold height and interrupted visual information, the more decrease in stability.
When comparing of 2 variables, due to increase of impact types (PVF, loading rate) during landing on solid ground condition, increase of COP area also assumes to be correlated with equilibrium and movement of COG. whereas COP variables compared with interrupted visual information as main effector did not show difference, show more reduced COP area in case of 1st, 2nd, 3rd stair and showed rapid increasing trend in case of driver seat than noninterrupted visual information.
Predictable ability of an estimating time getting into contact with ground surface of foot through visual information on the landing height during downward stepping is critical factor to reduction of impulse force (Santello et al., 2001; Santello and McDonagh, 1998). In fact, it was reported that occurrence time of impulse force after landing was shorter than reaction time of muscle to sensory signal during absorbing an impulse (Nigg and Liu, 1999). Therefore it was assumed that reduction of DPSI according to increase of foothold height of truck was related with the failure of sufficient time securement for posture control during landing on ground (Brazen et al., 2010; Zhou et al., 1998).
Furthermore interrupted visual condition of the study influenced on the increasing trend of stability index (MLSI, APSI, VSI, and DPSI) and rapid increasing trend of COP area (ML, AP, and area), but increase of COP area should done because of difficulty of stability securement during short time of landing, also it might result in failure of posture control against increase of vertical load. Particularly because prediction of falling injury with COP variables (Maki et al., 1994), downward stepping from 2nd, 3rd stair and jumping directly from driver seat in situation of interrupted-visual information may be cause of secondary falling injury.
Because threshold level of leg stiffness may differentiate from an individual traits and ground conditions, its absolute criterion may not fix, but injury may occur whenever too low or high of it normally (Butler et al., 2003). Driver’s habit confirming the spatial information against landing position during downward stepping from truck time enables to control properly the leg stiffness and PVF with preparatory prediction of air phase time and control of impulse force. Consequently the result of the study will be helpful to not only therapist of exercise rehabilitation but availability on diagnosis, evaluation, prediction, and types of impulse-falling injury-skeletal fracture.