


INTRODUCTION
The increase in the older population is a worldwide phenomenon. Korea is one of the countries where it has been progressing most quickly (Statistics Korea, 2011). Along with the population aging, the incidence of several age-related neural diseases such as Alzheimer’s disease, Parkinson’s disease, diabetes, hypertension, and arteriosclerosis has been constantly increasing (Sole, 2010). In particular, cognitive decline, including mild cognitive impairment (MCI), is very common in older adults, and it frequently converts into dementia within 6 yr (Li et al., 2011; Park et al., 2003).
Many previous studies have shown that cognitive decline is closely associated with visual dysfunctions such as in visual perception (VP) and visual-motor integration (VMI). Jackson and Owsley (2003) reported that changes in visual functions are the earliest remarkable signs of Alzheimer’s disease and Malloy et al. (2003) suggested that testing VMI is effective in discriminating whether elderly individuals have cognitive impairment such as Alzheimer’s disease or mild cognitive impairment. In addition, recent studies have shown that changes in visuospatial perception could be a potential biomarker to detect the early stages of cognitive decline. Visuospatial dysfunction has been found in mild cognitive impairment from children to older adults (Brown, 2011; Brown and Elliott, 2011; Graewe et al., 2012; Mandal et al., 2012). Recent studies have shown that VMI was lower in older adults with diabetes mellitus (DM) compared with those without DM (Yun et al., 2011) and that it has a retrograde association with age, thus suggesting effective methods to detect cognitive changes (Kim et al., 2013). However, there are still only relatively few studies to demonstrate the utility of VP and VMI for the detection of cognitive decline in older adults and there is no time-guideline on the measurement of cognitive decline for older adults.
Therefore, this study aimed 1) to investigate the changes of VP and VMI caused by aging in Korean adults in order to determine whether they can be used to detect cognitive decline, and what the critical period for cognitive decline might be; 2) to find out the main influencing factors on VP and VMI in older adults.
MATERIALS AND METHODS
Design
This study was an explanatory survey research to explore the differences between VMI-3R and K-DTVP-2 with comparing the results measured by them and investigate more appropriate measurement for the changes of visual perception and visual-motor integration by aging in Korean adults.
Participants
On condition that the number of groups 6, one-way ANOVA, effect size 0.40, statistical power 80%, and significance level 0.05, the total sample size for this study calculated by G-Power 3.1 is 90. Total participants of this study were separately 192 adults for VMI-3R and 139 for K-DTVP-2. The study was carried out from April to August in 2011 and participants were randomly recruited in Daegu and Gyeongbuk in Korea. The inclusion criteria were 1) adults from 20 to 79 yr old who could communicate, understand the purpose of the research, and give their consent for the participation of the study, 2) no visual difficulties, the defect of the visual field and motor disturbance that could affect response, 3) no history and medication for psychological problem, and 4) the completion of the survey.
The characteristics of the participants are shown in Table 1. The total number of participants in this study was 283. The range of age was between 20 and 79 yr old. All participants were measured gender, height, weight, BMI, the presence of diseases, and exercise patterns. The mean BMI of the participants aged 40 yr and older were above 23 meaning overweight. The weight and the presence of diseases were increased with aging (Table 1).
Measurements
K-DTVP-2
DTVP was initially designed to measure children’s visual perceptual characteristics by Frostig in 1961. After that, it was revised into DTVP-2 that classified as 2 sub-items, Motor-Reduced Visual Perception (MRP) and Visual-Motor Integration (VMI). K-DTVP-2 is the Korean version of DTVP-2 to measure 4 to 8 yr old children’s visual perceptual ability and helps to identify concrete visual-perceptual disability in developmental stages (Moon et al., 2003).
K-DTVP-2 consist of 8 sub-tests, 1) eye-hand coordination, 2) position in space, 3) copying, 4) figure-ground, 5) spatial relations, 6) visual closure, 7) visual-motor speed, and 8) form constancy. Moon et al. (2003) have proposed that the original total score of each sub-item must be converted to the standard score to compare and interpret because the upper limits of them are respectively different. The General Visual Perception Quotients (GVPQ) converted sum of standard scores of sub-items into with an average of 100 and a standard deviation of 15 is the most reliable DTVP-2 score. It includes Motor-Reduced Visual Perception Quotients (MRPQ) and Visual-Motor Integration Quotients (VMIQ). GVPQ <70 means very low-grade, 70–79 low, 80–89 below the average, 90–110 on the average, 111–120 above the average, 121–130 high, and >130 very high-grade. It takes about 30 to 60 min to complete the entire test.
In this study, as the result of the internal consistency reliability test including the standard scores of the whole 8 sub-items to verify the reliability of K-DTVP-2, the Cronbach’s alpha was .883. To conduct confirmatory factor analysis for the K-DTVP-2, Kaiser-Meyer-Olkin (KMO) was .900 and the Bartlett’s test of sphericity was statistically significant (χ2=577.641, P<0.001). Therefore, it is suitable for further analysis. As the result that the principle component analysis for all 8 sub-items, the only one factor with eigen-value over one was extracted and explained 57.1% of the total variance.
VMI-3R
VMI-3R produced by Beery is applicable to from preschool children to adults and easy to carry out. Compared with original 24 points VMI (Beery, 1973), VMI-3R gives extra 1–3 points for difficulties of shapes and the total score of that became extended from 24 to 50 points (Beery, 1989).
The whole test consist of 8 pages including 24 shapes arranged up from the simplest to the most complex. The upper site of each page is composed with 3 kinds of geometrical shapes and the lower site of each page is empty space to draw shapes. The range of total score is 0 to 50 points. The mean time to complete test is 10 to 13 min.
In this study, as the result of the internal consistency reliability test including all 4 kinds of subcategory by difficulty to verify the reliability of VMI-3R, the Cronbach’s alpha was .641. To conduct confirmatory factor analysis for the VMI-3R, KMO(Kaiser-Meyer-Olkin) was .689 and the Bartlett’s test of sphericity was statistically significant (χ2=165.943, P<0.001). Therefore, it is suitable for further analysis. As the result of the principle component analysis for all 4 subcategories, the only one factor with eigen value over one was extracted and it explained 54.5% of the total variance.
Data collection
The data for this study were collected in Daegu and Gyeongbuk in Korea from April to August in 2011. All examiners of the survey completed the educational training to perform, analyze and score the results exactly. Pretests were conducted to verify reliabilities of measurement among the examiners before the survey. Researchers and examiners discussed the data collection process at the meeting once a week for the first 4 weeks, and after that, visited universities, work, welfare centers, senior centers, homes, parks, etc and explained the purpose of the study, obtained the consent of the participants, and collected the data with the questionnaire through face to face interviews.
Data analysis
The data were analyzed with Statistical Package for Social Science (SPSS) version 18.0. General characteristics of participants were expressed as frequency, percentage and mean±standard deviation (SD). The differences of scores of VMI-3R and K-DTVP-2 among six 10-yr age groups were investigated separately with ANOVA test and statistically significant differences were verified with Scheffe post-hoc test. Association between two measurements was assessed with correlation analysis and factors to affect each VMI-3R and K-DTVP-2 were investigated with multiple regression analysis. The level of statistical significance was set at P<0.05.
RESULTS
Changes of K-DTVP-2 score by age
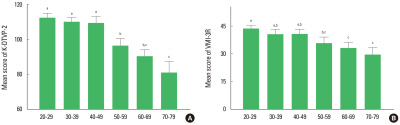
The changes of K-DTVP-2 score by age (from 20s to 70s) were shown in Fig. 1A. The mean score of K-DTVP-2 were 112.33± 6.45 in 20s, 109.93±5.71 in 30s, 109.30±8.73 in 40s, 96.28 ±9.96 in 50s, 90.30±8.63 in 60s, and 80.85±15.05 in 70s. The present results showed that there were statistical differences among the groups (F=41.120, P<0.001) and the mean score of K-DTVP-2 was significantly decreased from 50s compared to that in 20s. In particular, the mean score of K-DTVP-2 in 60s were on the borderline to average (Fig. 1A).
Changes of VMI-3R score by age
The changes of VMI-3R score by age (from 20s to 70s) were shown in Fig. 1B. The mean score of VMI-3R was 43.47±6.54 in 20s, 40.38±5.88 in 30s, 40.55±6.83 in 40s, 35.66±8.94 in 50s, 33.00±7.59 in 60s, and 29.40±9.47 in 70s. The present results showed that there were statistical differences among the groups (F=16.583, P<0.001) and the mean score of VMI-3R was significantly decreased from 50s compared to that in 20s (Fig. 1B).
Influencing factors on the K-DTVP-2 score
The results of multiple regression analysis considered gender, age, BMI, the presence of diseases, and exercise patterns as predictors on K-DTVP-2 score were shown in Table 2. The significant affecting factor on K-DTVP-2 score were (t=−9.130, P<0.001), gender (t=3.029, P=0.003), and the presence of diseases (t=−2.504, P=0.013). It showed that the K-DTVP-2 score were decreased with increasing age (B=−0.512), the presence of diseases (B=−5.457), and female (B=5.054) and the model explained 62.7% of the total variance (F=44.710, P<0.001) (Table 2).
Influencing factors on the VMI-3R score
The results of multiple regression analysis considered gender, age, BMI, the presence of diseases, and exercise patterns as predictors on VMI-3R score were shown in Table 3. The significant affecting factor on VMI-3R score was only age (t=−6.300, P<0.001). It showed that the VMI-3R score decreased with increasing age (B =−0.224) and the model explained 34.4% of the total variance (F=19.510, P<0.001) (Table 3).
DISCUSSION
Visual functions have recently been suggested as factors to detect cognitive decline. This study intended to investigate the changes of visual functions caused by aging in Korean adults with the K-DTVP-2 and VMI-3R tests.
Primary results in this study showed that the mean scores of the K-DTVP-2 and VMI-3R continuously decreased with age. Among the 10-yr age groups, from the 20s to 70s, the youngest population had the highest mean score, and the oldest had the lowest on both measurements. In both tests, the scores for VP and VMI had decreased in the 50s group compared to the 20s. Even though age-groups with the highest mean score for visual function in each measurement are different, the main results of previous studies - the visual deficits are caused by aging - are consistent with the present result (Brown and Elliott, 2011; Brockmole and Logie, 2013). It has been reported that visual working memory (VWM) develops until the age of 20 and then declines continuously with age. The mean VWM score of a 55 yr old is lower than that of 8 and 9 yr olds (Brockmole and Logie, 2013). Brown and Elliott (2011) also reported that VP constantly develops until the age of 39 and then gradually deteriorates. Together with the previous studies, the present study supports the idea that cognitive functions included in VP and VMI decline by aging, and suggests that individuals in their 50s could be in a critical period to start to decrease in cognitive function. Until now, there have been few longitudinal studies for age-related cognitive changes because of their cost and time (Sole, 2010). Therefore, whether the regular screening of VP and VMI is needed from age 50 in order to detect cognitive declines caused by aging should be considered.
In this study, we also investigated main factors affecting changes of the scores of the VP and VMI measurements. Age, gender, BMI, the presence of diseases, and exercise patterns were examined as predictors in both measurements. Age, gender, and presence of diseases had an influence on the decrease of the K-DTVP-2 score, and age alone had an influence on the decrease of the VMI-3R score. Many studies demonstrate that visual function is changed by aging. Christensen et al. (2001) proposes that age directly affects changes of visual function, and Herrera-Guzmán et al. (2004) have reported that age is an influencing factor of VP in healthy older adults aged 50 to 80. Recently, Kim et al. (2013) showed that VP and VMI are affected by age. On the other hand, gender and the presence of diseases had an influence only on the score of the K-DTVP-2 in this study. The present result showed that females and individuals with some diseases had lower K-DTVP-2 scores compared to men and healthy individuals, respectively. Several studies on cognitive function, including VP and VMI, support the present results with regard to gender (Herrera-Guzmán et al., 2004; Kim et al., 2013; Pauls et al., 2013) and some diseases including diabetes, depression, and neurological impairment (Brown, 2011; Yun et al., 2011;). In contrast, Tekok-KiliÇ et al. (2010) reported that there is no sex difference in VMI in children aged 6 to 15 yr old. Therefore, it could be suggested that the most determinate factor on VP and VMI is age. Other factors such as gender, education, and smoking could be additionally considered in further studies.
In the present study, K-DTVP-2 and VMI-3R were positively correlated with one another. This result indicates that both measurements for cognitive function could be supposed to detect cognitive decline by aging. Several studies have demonstrated that cognitive decline is related to visual perceptual dysfunction (Anderson, 2003; Brown, 2011; Jackson and Owsley, 2003), visual perception (Brown and Elliott, 2011), and visual dysfunctions (Jackson and Owsley, 2003). Comparing standardized coefficients, Cronbach’s alpha, and explanatory power between the two measurements, the K-DTVP-2 seems to be more strongly affected by age than the VMI-3R. However, the K-DTVP-2 is more sensitive other factors such as gender and disease. In addition, the K-DTVP-2 covers more cognitive fields, such as both VP and VMI at the same time. On the other hand, VMI is more easily checked in participants, and in less time. Therefore, it could not yet be determined which measurement is the most reliable and sensitive to detect cognitive decline by aging.
In conclusion, the present results show that VP and VMI had declined steadily with aging and had significantly decreased by the time participants were in their 50s, compared to participants in their 20s. The main influencing factor on both VP and VMI is age, and the changes of K-DTVP-2 score were affected by age, gender, and the presence of diseases. Related to the measurement, K-DTVP-2 and VMI-3R had a strong correlation with each other and K-DTVP-2 changed more sensitively than VMI-3R by age because K-DTVP-2 is inherently more sensitive and covers more cognitive fields. Based on these results, it can be suggested that VP and VMI should be checked regularly from at least the 50s, which is a critical period for detecting cognitive decline by aging, Both K-DTVP-2 and VMI-3R could be used for determining the level of cognitive deficits induced by aging. Further study is needed to review the effect of VMI on detecting cognitive decline in the elderly.