Proposal of a normative table for body fat percentages of Brazilian young adults through bioimpedanciometry
Article information

Abstract
Identification of the body fat (BF) percentage allows health professionals to detect healthy or risky patterns in a population. However, no studies have elaborated BF cutoff points using the bioelectrical impedance method in young Brazilian adults. Thus, the objective of the present study was to elaborate normative tables for BF in Brazilian men and women (sedentary and physically active) between 18 and 39 years of age. A total of 3,111 adults (958 men and 2,153 women) were evaluated using bioimpedance measurements with the InBody 520 device. The data were distributed normally and divided into percentiles (P3, P10, P25, P50, P75, P90, and P97). The following values were observed: for men: P3=8.9%–12.5%; P10=12.6%–17.5%; P25=17.6%–25.3%; P50=25.4%–35.1%; P75=35.2%–43.0%; P90=43.1%–49.4% and P97=49.5%; for women: P3=18.7%–23.1%; P10=23.2%–28.7%; P25=28.8%–35.7%; P50=35.8%–42.9%; P75=43.0%–49.1%; P90=49.2%–52.1% and P97≥52.2%. These percentiles can be used to classify the adiposity of sedentary and physically active individuals evaluated by bioimpedanciometry.
INTRODUCTION
Obesity and its associated comorbidities represent a barrier to adherence to physical activity programs (Greenwood-Hickman et al., 2016; Forechi et al., 2018; Liang et al., 2017), and consequently impairs the success of rehabilitation strategies using this modality. The relationship between obesity and pain has been reviewed as a relevant factor reducing functionality and barrier to physical activity practice (Narouze and Souzdalnitski, 2015). In addition, emerging evidence suggests that body fat (BF), not body weight, is a major risk factor for musculoskeletal pain (Walsh et al., 2018). This fact can be explained by the constant production of inflammatory cytokines by adipose tissue, which is associated with the onset of musculoskeletal pain (Da Cruz Fernandes et al., 2018). Thus, a reliable analysis of BF composition becomes relevant when the design of physical activity rehabilitation strategies is proposed.
Therefore, although the body mass index (BMI) has been widely applied to categorize the nutritional status of children, adolescents, adults, and older adults (World Health Organization, 2018), its use in determining body composition is questionable (Branco et al., 2018; Nardo Junior et al., 2018). Using merely the BMI, individuals with a high muscle mass may be mistakenly classified as overweight, and those with a reduced lean mass and increased adiposity may be classified as normoweight (Daniels, 2009; Flegal et al., 2009; Rezende et al., 2010). These results suggest that although the BMI can be used to categorize the nutritional status, its use in determining body composition requires certain restrictions. Another measure that is widely used to determine body composition is measurement of skinfold thicknesses (ST), which estimates the BF percentage from different anatomical points (Fosbøl and Zerahn, 2015). However, the limitation of this method is restriction of opening of the skinfold caliper in individuals presenting with overweight or obesity due to difficulty pinching the subcutaneous fat, leading to an underestimated value (Duren et al., 2008; Kuczmarski et al., 1987). These possibilities suggest the need for relevant adjustments.
In light of technological advances, electric bioimpedance analysis (BIA) and dual energy X-ray absorptiometry (DXA) have emerged as important tools for the determination of body composition, especially for adiposity analyses (Johnson Stoklossa et al., 2016). Although DXA offers greater efficiency in analysis of body composition and is classified as the gold standard of the indirect measures, this method presents some limitations, such as high costs for the analyses and maintenance (Adab et al., 2018). In contrast, for BIA, the costs for both conducting the analyses and maintenance are lower than those of DXA (Beraldo et al., 2015). In addition, BF composition determinations performed using BIA are highly correlated with those determined by DXA (Miller et al., 2016). Thus, the use of BIA seems to be appropriate for body composition analyses, especially in situations with financial restrictions.
Considering the possibility of using BIA to determine the fat mass, the need to standardize cutoff points for BF emerges as a new challenge for health researchers. In fact, the lack of cut-off points for BF has been highlighted in several studies, especially those referring to the control of obesity and associated comorbidities (Coin et al., 2008; Gallagher et al., 2000; Lohman et al., 1997). Since large epidemiological studies focusing on obesity consider body composition based on BMI or ST, which are normally used to guide the design of public policies, the standardization of specific cutoff points to determine BF has great relevance. As a current example, more than half of Brazilians aged 18 years or over are overweight, and at least one in five Brazilian citizens is classified as obese according to their BMIs (Ministério da Saúde, 2018). For this particular population, these nutritional standards will drive government actions to control obesity in the future; however, if the sensitivity of use of the BMI or ST to determine adiposity is not the most accurate method, then the implemented antiobesity programs may not serve the population effectively.
Thus, based on the necessity of proposing cutoff points for BF to provide reference values for classification of body composition in young adults, the objective of this study was to elaborate percentiles for the classification of BF in Brazilians aged 18–39 years using bioimpedanciometry.
MATERIALS AND METHODS
Participants
This study is a descriptive, cross-sectional study conducted between 2014 and 2017 in southern of Brazil. The study was conducted in young adults (n=3,111) who were voluntarily recruited through online social networks, newspapers and posters arranged in basic health units. Only young Brazilians between the ages of 18 and 39 years who were sedentary or physically active were included in the study. Athletes of any sporting modality, pregnant or menstruating women, holders of cardiac pacemakers, and paraplegic or tetraplegic patients were excluded. A total of 958 young males (age, 28.1±2.5 years old) and 2,153 females (age, 27.7±2.1 years old) were evaluated. All participants signed the Free and Informed Consent Term in accordance with Resolution 466/2012 of the National Health Council of the Ministry of Health and the Declaration of Helsinki. The study was approved by the local ethics committee (protocol number: 2,655,268/2018).
Anthropometry and body composition
Body mass was measured using BIA multifrequencial four-phase bioimpedance (InBody model 520, Biospace Co., Ltd., Seul, Korea) with a 250-kg capacity and 100-g precision. Before the bioimpedanciometry evaluation, the participants were instructed to make the following preparations: (a) fast for 4 hr (without ingestion of any type of solid or liquid); (b) urinate prior to the evaluation; (c) do not perform moderate or intense physical activity 24 hr before the evaluation; (d) do not eat caffeinated beverages 24 hr before the evaluation; (e) do not use diuretic medication 7 days before the evaluation and (f) menstruating women were invited to perform the evaluation during the postmenstrual period. Stature was measured using a stadiometer coupled to the wall (Sanny model ES2040, São Paulo, Brazil) with a precision of 0.1 cm (Wagner and Heyward, 1999). The BMI was calculated by dividing the body mass (kg) by height (m)2 (World Health Organization, 2018).
The BF was measured by the InBody model 520 (descriptions shown above) following the recommendations proposed by Heyward (1996). The InBody 520 was previously validated by Malavolti et al. (2003) in assessments conducted in 68 women and 42 men aged 21 to 82 years using the results obtained with DXA for validation. The BF was distributed in the 3rd, 10th, 25th, 50th, 75th, 90th, and 97th percentiles according to Cole and Green (1992), and the following classifications were utilized: “low, below normal, normal, above normal, excessive, very excessive and extremely excessive.”
Statistics
The data were subjected to normality analysis using the Kolmogorov-Smirnov test and distributed into the 3rd, 10th, 25th, 50th, 75th, 90th, and 97th percentiles. The mean, standard deviation, range and confidence intervals (95% CIs) were calculated for body mass, stature, BMI, BF, fat mass and musculoskeletal mass. Moreover, Pearson correlation was used to identify possible correlations between the BMI and BF. The correlations were classified as follows: <0.1 [trivial]; >0.1 to <0.3 [small]; >0.3 to <0.5 [moderate]; >0.5 to <0.7 [large]; >0.7 to <0.9 [very large]; and ≥0.9 to 1.0 [almost perfect] according to Hopkins et al. (2009). For the correlations, the significance level was set at 5%. The statistical analyses were performed using the IBM SPSS Statistics ver. 20.0 (IBM Co., Armonk, NY, USA).
RESULTS
Data on anthropometric characteristics for the young males and females are presented in Tables 1 and 2, respectively. The mean BMI was 28.1 kg/m2 for the males and 27.5 28.1 kg/m2 for the females. The mean BF was 26.7% for the males and 35.9% for the females. The mean fat mass was 24.0 kg for the males and 26.8 kg for the females. The mean musculoskeletal mass was 34.3 kg for the males and 24.1 kg for the females. Additionally, a correlation of r=0.80 (very large) was detected between the BMI and BF for men. For women, a correlation of r=0.88 (very large) was identified between the BMI and BF.
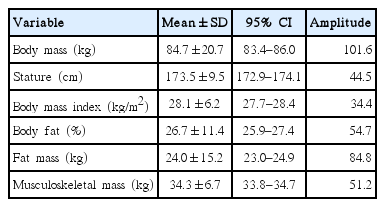
Anthropometric characteristic values of young adult males (n=958)

Anthropometric characteristic values of young adult females (n=2,153)
Table 3 presents data referring to cutoff points for the classification of BF in young adult males and females. The values considered normal are in the range of 17.6%–25.3% for males and 28.8%–35.7% for females. Values below these ranges were grouped as low and below normal, whereas those above the range were rated as above normal, excessive, very excessive and, extremely excessive.

Cutoff points of body fat percentages (P) in young male adults (n=958) and females (n=2,153) by bioimpedanciometry
DISCUSSION
In view of the need to determine cutoff points for the classification of BF, we utilized BIA to ensure reliable measurement of anthropometric parameters in a population of young Brazilian adults of both sexes. After normalization of the data, it was determined ranges of BF distributed in different percentiles of the normalization curve. The applicability of the cutoff points established for BIA denotes a new possibility of categorizing BF into the following 7 classes: low, below the normal, normal, above normal, excessive, very excessive, and extremely excessive. In this sense, a BF classification for sedentary or physically active Brazilian young adults is suggested, since the previous normative tables are not specific for this population.
A similar classification has also been described for BMI in adults as follows: low weight, normal, overweight, class I obesity, class II obesity, and class III obesity (World Health organization, 2018). Unquestionably, this BMI classification has been clearly associated with type II diabetes mellitus (Ng et al., 2014; Liang et al., 2017) hypertension (Jackson et al., 2014), and other chronic noncommunicable diseases, especially in population studies (Ng et al., 2014; Nguyen et al., 2008). However, in individual evaluations, the BMI does not seem to be effective in detecting risks associated with waist circumference (11.1%), the waist-hip ratio (36.1%), and BF (36.1%) because it presents low predictive values; thus, this factor can generate bias in the interpretation of results, resulting in clinical conducts with questionable effectiveness (Rezende et al., 2010).
Hence, the standardization of cutoff points for BF from BIA presented herein could have great value for future studies aimed at associating these parameters with the management of chronic noncommunicable diseases. In addition, adequate follow-up of BF is also relevant in the study of exercise rehabilitation, since musculoskeletal pain is modulated by cytokines released by adipose tissue (Da Cruz Fernandes et al., 2018). Importantly, the objective of standardizing values for specific BF cutoffs is that it offers another tool to aid in anthropometric design with a specific focus on adiposity determination without ignoring the indispensable role of BMI in this context.
By applying the Hopkins et al. (2009) classification, it was found a very large correlation between BMI and BF in both men and women. However, the applicability of BMI for identifying success in a weight loss program is low because the BMI does not identify the fat mass and lean mass (Branco et al., 2018). The success of a weight-loss program is closely linked to lean mass gain and fat mass reduction, as noted by Nardo Junior et al. (2018). Therefore, BIA can be a useful tool for monitoring the lean body mass and fat mass in clinical evaluations (Zeng et al., 2012). Other authors, such as Zhu et al. (2003), found that the BMI cutoff points could predict the risk of metabolic syndrome. In the same perspective, the same authors found that the BF measured by BIA analysis might also identify risks for metabolic syndrome.
Additionally, the proposed classifications (low and below the normal, whereas those above the range were rated as above normal, excessive, very excessive, and extremely excessive) were chosen because they resembled the cutoff ranges used in adults based on the BMI (Bradbury et al., 2017; World Health Organization, 2018). Furthermore, the population study of Bradbury et al. (2017) identified correlations of r=0.85 in women and r=0.79 in men for the BMI and BIA, which showed that these factors were closely associated, as presented herein.
Although the proposed BF classification is an important tool for the analysis of adiposity, rationally, the reference parameters may vary within the different methods used to estimate the body composition (Lemos and Gallagher, 2017). From this perspective, McLester et al. (2018) identified significant differences between body composition measurements from DXA and BIA (InBody 230, InBody 720, and InBody 770) for lean mass and fat mass. Therefore, in view of this evidence, a method comparison is not recommended.
However, a comparison between different devices using the same or different methods does not seem to be as relevant. De Faria et al. (2014) compared the BF obtained with horizontal 4-electrode tetrapolar BIA (model 450, Biodynamics, Shoreline, WA, USA), vertical 8-electrode tetrapolar BIA (InBody model 230) and DXA (Lunar Prodigy Advance DXA System – analysis version: 13.31, GE Healthcare, Chicago, IL, USA) showing different values for BF in men and women who are categorized as overweight. They also demonstrated that DXA tends to present higher values when compared to the two BIAs used, with the vertical BIA showing higher values than the horizontal BIA. Therefore, the results of de Faria et al. (2014) illustrate that each device provides different BF data. In view of the differences identified, population studies need to be conducted to establish normative data for various BIA measurement devices and unique populations (i.e., sex, age, ethnicity, fitness levels and among others).
Nevertheless, recently Yang et al. (2018) identified very strong correlations between DXA (Hologic Inc., Bedford, MA, USA) and different BIAs models: ACCUNIQ (BC720, BC360 and BC380, Selvas Healthcare Inc., Seul, Korea), in men (n=97) and middle-aged women (n=103). Evidently one may assume that the differences between the measures are linked to the types of equipment. In view of these data related to BF assessment methodologies, a more thorough examination of the various measurements with the gold-standard measurement is necessary.
Notably, the applicability of the BF classification is restricted to BIA. Thereby, new classification tables for BF obtained using different methods must be designed by considering the variability of cutoff points, which might underestimate or overestimate the obtained values. Regardless of the highlighted limitations, the classification of BF presented herein is an innovative proposal developed from the use of BIA in young Brazilian adults.
Therefore, future studies that seek to propose cutoff parameters for BF using different methods and/or equipment in children, adolescents, young adults, middle-aged adults, and older adults are encouraged to provide more reliable parameters for clinical management. In addition, we believe that the establishment of an adiposity classification based on more reliable BF parameters, such as those obtained by BIA, may also assist physical education professionals, nutritionists, and others in assessing body composition to subsidize health promotion actions.
Notes
CONFLICT OF INTEREST
No potential conflict of interest relevant to this article was re ported.
ACKNOWLEDGMENTS
The authors of this study thank the Cesumar Institute of Science, Technology and Innovation (ICETI), for the support provided.