The morphological and functional effects of exercise in the aquatic environment, performed before and/or after sciatic nerve compression in Wistar rats
Article information
Abstract
The aim of this study was to evaluate the effects of exercise in the aquatic environment, performed before and/or after sciatic nerve compression in Wistar rats on morphological and functional parameters. Twenty-five Wistar rats were divided into the following groups: control (C), lesion (L), trained+lesion (TL), lesion+exercise (LE), and training+lesion+exercise (TLE), who underwent right sciatic nerve compression on day 21 of the experiment. The TL and TLE groups were submitted to a jumping exercise in a water environment for 20 days prior to injury and the LE and TLE groups after injury. The functional analysis was carried out using the sciatic functional index (SFI). On the last day of the experiment, the right sciatic nerves were collected, processed and analysed according to morphology and morphometry. The C group showed higher SFI in relation to the other groups. In the morphometric analysis, in comparison to C, all groups showed a decrease in the diameter of the injured nerve fibre, the myelin sheath and an increase in the percentage of connective tissue. There was a decrease in axon diameter in L, TL, and LE groups and a decrease in the density of nerve fibres in the TL and LE groups. The exercise did not affect functional recovery. However, the exercise prior to the injury improved morphology of the nervous tissue, and when performed pre- and postinjury, there was also an improvement in nerve regeneration, but this was not the case with exercise performed after the injury demonstrating worse results.
INTRODUCTION
Peripheral nerve injuries have a major impact on patients and their ability to perform daily activities including returning to work; this creates social and economic concerns (de Albornoz et al., 2011; Faroni et al., 2015). One of the experimental models used to study this type of injury is sciatic nerve compression in rats, which is the most common compressive neuropathy of the lower limb, has easy surgical access and its ramifications are well characterised (Craig, 2013; Savastano et al., 2014).
Peripheral nerve injuries result in functional and morphological changes in the nervous, connective and muscle tissues innervated by the injured branch. The histological technique is often used to observe the morphological changes in the nerve tissue, such as decreases in the nerve fibre diameter, axon thickness and myelin sheath (Bobinski et al., 2011; Lima et al., 2012; Savastano et al., 2014). Such changes may become permanent due to slow and often incomplete regeneration (de Albornoz et al., 2011; Faroni et al., 2015; Savastano et al., 2014).
Thus, interventions are required to accelerate the recovery of peripheral nerves in order to minimise the effects of nerve injury (Isaacs, 2013). Artifon et al. (2013) suggested the use of resistance exercise prior to nerve injury including jumping in the aquatic environment (Gaffuri et al., 2011), because this generates muscle hypertrophy and increases neuromuscular junctions minimising the effects of sciatic nerve compression (Artifon et al., 2013; Deschenes et al., 2000). The viability of the muscle tissue is important, since contraction occurs through the release of neurotrophic factors relevant to neuronal survival (Faroni et al., 2015; Pedersen, 2011).
According to Bobinski et al. (2011), the preventive effect of exercise promoting neuroprotection has been widely studied in the central nervous system, however, rarely addressed in the peripheral nervous system. Furthermore, exercise performed after the nerve injury also becomes important for the maintenance of nervous tissue and neurotrophic support. However, although mentioned, there is no scientific evidence documenting the effectiveness of exercise in peripheral neuropathies (de Albornoz et al., 2011), making studies on the use of exercise pre- and postnerve injury, and their combination, relevant. Therefore, the aim of this study was to evaluate the effects of exercise in the aquatic environment performed before and/or after sciatic nerve compression in Wistar rats on morphometric and functional parameters.
MATERIALS AND METHODS
This study was conducted according to international standards of ethics in animal experimentation, and approved by the Ethics Committee on Animal Use Unioeste (11/11/2014).
Twenty-five male Wistar rats, 8 weeks of age with an average initial weight of 314±23 g were kept in a light-dark photoperiod of 12 hr at 23°C, with water and food ad libitum. The animals were randomly and equally distributed into five groups:
Control (C): no intervention, euthanized on 42nd day.
Lesion (L): underwent nerve compression on day 21 of the experiment, euthanized 21 days postoperatively (PO).
Trained+Lesion (TL): were trained with resistance exercise for 20 days, 3 times a week. Subsequently underwent nerve compression on day 21, euthanized 21 days PO.
Lesion+Exercise (LE): underwent nerve compression on day 21 of the experiment, and later performed resistance exercise for 20 days, and euthanized 21 days PO.
Trained+Lesion+Exercise (TLE): trained with resistance exercise for 20 days, 3 times a week. On day 21 of the experiment, they were subjected to nerve compression, and subsequently submitted to resistance exercise for 20 days, euthanized 21 days PO.
Resistive exercise protocol
The exercise protocol consisted of aquatic jumps: the animal was placed in a cylindrical shaped tube with a diameter of 30 cm and height 55 cm, inside a 200-L tank of water at 33°C±1°C. An overload of 50% of the animal’s weight was applied by means of a Velcro strap in the thoracic region, causing the animal to be submerged and, upon reaching the bottom of the tank, created an impulse to reach the surface. Each pulse was recorded as a jump (Gaffuri et al., 2011).
The jump protocol was performed for 20 days, 3 times a week with 1-day interval, and every week with a 2-day interval. In the first week there were two sets of ten jumps, in the second week three sets of 10 jumps, finishing the third week with four sets of 10 jumps with 30-sec intervals between each series. Pre-exercise protocol and postinjury were similar, with the only difference being that after the injury the exercise began on the 3rd day PO.
Experimental model sciatic nerve compression
Prior to sciatic nerve compression surgery, the animals were weighed and anesthetised with ketamine hydrochloride (80 mg/kg) and xylazine (20 mg/kg) intraperitoneally. Subsequently, an incision to expose the right sciatic nerve and subsequent crushing thereof was conducted with a haemostat for 30 sec. The clamping pressure was standardised for all animals, using the second tooth rack as a reference, and all pinching was performed by the same individual (Bridge et al., 1994). After the nerve compression procedure, a 10.0 nylon thread was passed through the epineurium, the point corresponding to the proximal edge of the lesion to facilitate location in subsequent histomorphological procedures (Mazzer et al., 2008). The animal’s skin was sutured with catgut 4.0.
Sciatic function index
Sciatic function index (SFI) measures functional gait analysis by obtaining video images using a treadmill with a controlled speed (Insight, São Paulo, Brazil). A webcam, fitted with a USB cable that connected directly to a laptop, documented the Monte-Raso et al. (2010) protocol. After the shooting, an image of each animal was selected and evaluated in the programme Image Pro-Plus 6.0 (Media Cybernetics, Inc., Rockville, MD, USA), measuring the following parameters: length of the footprint (print length, PL), the full opening of the fingers, from 1st to 5th (total spread of toes, TS) and the opening of the middle fingers, the 2nd to 4th (intermediate toes, IT), the injured or experimental side (E) and contralateral normal side (N). Once the parameters were registered, we calculated the value of the SFI in Excel, using the formula (Bain et al., 1989):
The animals were trained to walk on the treadmill for 5 days prior to the sciatic nerve compression procedure. Six reviews were performed in all animals (Table 1).
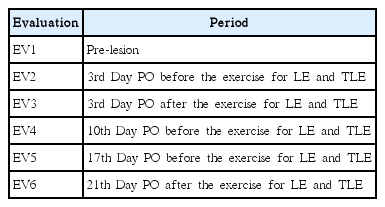
Evaluation periods of Functional Sciatic Index
Histomorphometric analysis
On the last day of the experiment, the animals were anesthetised with ketamine hydrochloride (80 mg/kg) and xylazine (20 mg/kg) intraperitoneally. Dissection and removal of 2 cm of the sciatic nerve (divided into first and second fragments) distal to the compression procedure were performed. Then, the animals were euthanized by guillotine decapitation.
The first fragment was fixed in 4% paraformaldehyde in phosphate buffered saline (PBS) (pH, 7.4) for 48 hr and then stored in 70% alcohol until histological processing. The sciatic nerves were postfixed with osmium tetroxide 2% in PBS to obtain nerve cross-sections with a thickness of 5 μm. The histological slides were mounted, photomicrographs at 10× (one field) and 100× (4 fields) were taken and analysed with Image Pro-Plus 6.0.
Then, the nerve regeneration was evaluated using the following parameters: nerve fibres and axon diameters; myelin thickness; G ratio, the ratio between the myelin thickness to the nerve fibre diameter; average density of nerve fibres, the ratio of the total number of nerve fibres within the field, in the area; and estimating the total number of fibres, the average fibre density divided by the total number of nerve fibres within the field, by their area.
The second fragment was fixed in bouin for 24 hr at 4°C, following the routine histological processing for paraffin embedding: dehydration; diafanization; infiltration of histological paraffin; and nerve cross-sections with a thickness of 5 μm. The nerves were stained with Masson’s trichrome for the density of blood vessels and connective tissue quantification.
For the density of blood vessels, the total count of the number of blood vessels under the microscope with a 40× objective was then divided by the total number of vessels over total nerve area. For the connective tissue analysis, a planimetry system was used by counting points, similar to the study by Pereira et al. (2014), with squares 225 μm2, resulting in 108 intersections by photomicrograph. The matching intersections in the endoneurium were counted in 4 fields per nerve (photomicrographs with 100×objective), totalling 432 points per animal using Image Pro-Plus 6.0. The relative tissue area was calculated by the rule of three: multiplying the number of matching points on the straight line intersections on the connective tissue (endoneurium) by 100 and dividing the result by the total number of points.
To count cell nuclei, hematoxylin and eosin (H&E) stain was used and photomicrographs with 100×objective (four fields) were taken and analysed using the Image Pro-Plus 6.0 software, including the nuclei that were touching the edges called “inclusion” (top and left) and excluding those touching the “exclusion edges” (bottom and right). Qualitative analysis using the description of the general morphology of the nervous tissue also took place.
Statistical analysis
Data were evaluated first for normality using the Shapiro–Wilk test and if a normal distribution, analysis of variance (ANOVA) mixed model was used for comparing the SFI; comparisons of morphometry were analysed using a one-way ANOVA followed by t-test when there was a statistically significant difference. Significance was defined as P<0.05. The results were expressed using F statistics and averages.
RESULTS
Sciatic function index
A statistically significant difference was found (F [5, 330.6]= 16.9, P=0.0001) with the C group demonstrating greater SFI in comparison to the other groups (P=0.0001). When comparing the evaluations, there was also a statistically significant difference between the evaluation 1 (EV1) and EV2–EV5 (P=0.0001); EV1 was greater than the following groups and there was also a statistically significant difference between EV2 and EV6 (P=0.004), the smallest EV2 that EV6 (Table 2).
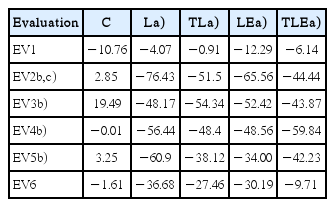
Sciatic Functional Index averages for groups and evaluations (EV)
Nerve fibre diameter
There was a statistically significant difference (F [4, 20]=6.86, P=0.001) for nerve fibre diameter with decreasing diameter in the groups L (P<0.001), TL (P=0.005), LE (P<0.001), and TLE (P=0.0318), compared to C. There was also a statistical significant difference between LE and TLE groups (P=0.0254), with the TLE group having a larger diameter (Fig. 1A).
Average diameters of nerve fibres (A), axons (B), myelin sheath (C), and the G ratio (D). C, control; L, lesion; TL, trained + lesion; LE, lesion + exercise; TLE, trained + lesion + exercise group subjected to nerve damage and exercise. *Difference compared to C. +Difference compared to TLE.
Axon diameter
There was a statistically significant difference between groups (F [4, 20]=7.08, P=0.001) for axon diameter with the groups L (P<0.001), TL (P=0.0036), and LE (P<0.001) having a smaller diameter compared to group C. There was also a statistically significant difference between the TLE and LE groups (P=0.0107), with the TLE group having the highest average (Fig. 1B).
Myelin sheath diameter
There was a statistically significant difference (F [4, 20]=5.014, P=0.006) for myelin sheath diameter, with the L (P=0.0012), TL (P=0.0185), LE (P<0.01), and TLE (P=0.0403) groups showing a smaller diameter than group C (Fig. 1C).
G ratio
There was no statistically significant difference (F [4, 20]=1.0, P=0.405) (Fig. 1D).
Total number of nerve fibres
There was no statistically significant difference (F [4, 20]=2.0, P=0.135) (Fig. 2A).

Total number of nerve fibres (A) and average density of nerve fibres (B). C, control; L, lesion; TL, trained + lesion; LE, lesion + exercise; TLE, trained + lesion + exercise group subjected to nerve damage and exercise. *Difference compared to C. +Difference compared to TLE.
Average density of nerve fibres
There was a statistically significant difference (F [4, 20]=4.1, P=0.013) for nerve fibre density with a lower average density in the TL (P=0.0219) and LE (P=0.0081) groups, compared to group C. There was also a statistically significant difference between the TLE group compared to TL (P=0.0134) and LE (P=0.0049) groups, with the TLE group having a higher average (Fig. 2B).
Blood vessels density
There was a statistically significant difference between groups (F [4, 2]=4.0, P=0.0147) for blood vessel density with TL (P= 0.0215) and TLE (P=0.0426) groups showing an increased density compared to C group. The L group was also statistically significantly lower than the LE (P=0.0034), TL (P=0.0374), and TLE (P=0.0073) groups (Fig. 3A).
Blood vessels density (A), connective tissue percentage (B) and cell nuclei density averages (C). C, control; L, lesion; TL, trained + lesion; LE, lesion + exercise; TLE, trained + lesion + exercise group subjected to nerve damage and exercise. *Difference compared to C. †Difference compared to TLE. ‡Difference compared to L. #Difference compared to TL.
Connective tissue percentage
There was a statistically significant difference (F [4, 2]=9.3, P=0.0004] for connective tissue with groups L (P<0.001), TL (P<0.001), LE (P<0.001), and TLE (P=0.0158) showing an increased percentage of connective tissue in comparison to group C. The TLE group was statistically significantly higher than the LE group (P=0.009) (Fig. 3B).
Cell nuclei density
There was a statistically significant difference (F [4, 2]=41.1, P=0.0136) for cell nuclei density, with increasing density in the groups L (P=0.0044), LE (P=0.0132), and TLE (P=0.0226) compared to group C. The TL group also had a statistically significantly lower average compared to L (P=0.0132) and LE (P= 0.0379) groups (Fig. 3C).
General morphology of nerve tissue
In group C, the axon and myelin sheath of nerve fibres was seen most clearly with the presence of few cell nuclei including Schwann cells and macrophages, and no signs of degeneration (Fig. 4A). The connective tissue was normal in appearance (Fig. 4B), and similar traits were observed in the TL group (Fig. 4G, H).
Photomicrographs of the sciatic nerve. ×100 magnification, 10 μm bar, stained with H&E (A, D, G, J, and M), Masson (B, E, H, K, and N) and Osmium (C, F, I, L, and O). Panels A, B, and C correspond to group C; panels D, E, and F are group L; panels G, H, and I are group TL; panels J, K, and L are group LE; panels M, N, and O are group TLE. *, on the axon; +, myelin; <, cellular nuclei; the arrow indicates the nerve fibre degeneration; ⋄, corresponds to the endoneural tissue; VS, corresponds to the blood vessel.
The TLE had the highest concentration of cell nuclei as compared to group C with axonal degeneration signs, however most of the nerve fibres and axons were observable (Fig. 4M). The connective tissue had a discontinuous point, which differed from group C (Fig. 4N).
While L and LE groups showed axonal degeneration signs in the majority of nerve fibres, they showed higher cell nuclei including Schwann cells, fibroblasts and primarily macrophages, and connective tissue with discontinuous points, which differed from group C (Fig. 4D, E, J, K).
DISCUSSION
Exercise is one of the ways to treat compressive neuropathies, because it promotes an anti-inflammatory environment, releasing mainly interleukin (IL)-6 without activating the inflammatory pathways, and increases circulating IL-1Ra and IL-10. The IL-6 increase is closely linked to the intensity of the exercise which is indirectly involved in muscle contractile activity (Terra et al., 2012), and it is related to the chronic effect of exercise (Silva and Macedo, 2011). These effects may have occurred in the TLE group because, besides the application of the exercise protocol that requires the use of large muscle groups, this group performed the exercise for a longer period and thus had chronic effects.
In this study, the exercise performed pre- or postinjury did not interfere in the restoration of the diameters of nerve fibres, whereas the combination of these protocols accelerated nerve regeneration, led to normalisation of axon diameter and improved the overall morphology of the nerve, but did not interfere with axonal maturation. This restoration of the axon diameter is a relevant factor because (Fraher and Dockery, 1998) stated that the axon diameter influences the diameter of the myelin sheath, as larger axons have thicker myelin sheaths. This suggests that the use of the TLE protocol, with a longer duration of exercising after nerve compression, could lead to standardisation of the diameter of the myelin sheath.
It is likely that this effect is related to the increased density of blood vessels that was observed in all groups who performed the exercise. Although not evaluated in this study, according to the literature, angiogenesis can be justified by increased plasma concentrations of IL-8 due to muscle contraction, which acts as an angiogenic factor (Pedersen, 2011; Terra et al., 2012). This vascularity increase is an important finding because during nerve injury the injury of endoneurial vessels occurs with hematoma formation and consequently ischemia, which can damage nerve regeneration (Pachioni et al., 2006). If the tissue has a higher number of vessels at the time of injury, it can minimise the effects of hypoxia and enhance nerve regeneration, which may explain the result for the TLE group.
However, the TL group, despite presenting some positive data, including general tissue morphology and decreased presence of cell nuclei, the increased vascularization did not lead to nerve regeneration, which may be explained by the lack of muscular activity after injury and reduced neurotrophic support, because exercise releases neurotrophic factors during muscle contraction (Isaacs, 2013), such as brain-derived neurotrophic factor – an important factor for regulating neuronal development (Pedersen, 2011; Terra et al., 2012).
In LE, increased vascularity may have had adverse effects, since this group showed the worst morphometric results including the smallest diameter of the myelin sheath, low average density of nerve fibres and a greater percentage of connective tissue. This fact may be due to reperfusion injury, which occurs when oxygenated blood returns to the tissues leading to production of a number of reactive oxygen species (ROS) (Piccinato, 2014). Furthermore Pereira and Souza Junior (2013) showed that sedentary individuals produce greater amount of ROS after exercise than trained individuals. This indicates the importance of the association of these pre- and postnerve injury protocols to minimise tissue damage and retain neurotrophic support, respectively.
Differences between the TLE and LE groups regarding the percentage of connective tissue were also observed with the LE group showing the highest amount of connective tissue, as well as higher density of cell nuclei compared to the TL group. During the regeneration process, the nerve fibres need to restore quickly before the Büngner bands are closed, otherwise scar tissue will be inaccessible to new innervation (Krueger-beck et al., 2011), which may have occurred in the LE group, justifying the increase in cell nuclei by increasing fibroblasts (Savastano et al., 2014), resulting in increased endoneural tissue.
Although there was a decrease in the myelin sheath for all injured groups, it did not change the G parameter ratio related to the conduction velocity of the nerve impulse (Oliveira and Teodori, 2012), demonstrating that the nerve conduction velocity was preserved. This fact may explain the functional recovery in all groups undergoing nerve damage, observed by the assessment of IFC, showing the relationship between the preservation of nerve conduction and limb function viability.
In relation to the total number of nerve fibres, sciatic nerve compression and exercise did not alter this variable, however, the exercise performed pre- or postinjury promoted a decrease in the average density of nerve fibres. This may have occurred because TL and LE groups presented nerve fibres with a smaller diameter.
However, the improvement of nerve regeneration in the TLE group was contrary to the literature regarding the use of resistance exercise, which is defined as the accomplishment of muscle contraction against resistance, strength or weight (Dourado et al., 2015). Ilha et al. (2008) compared resistance exercise with endurance in sciatic nerve regeneration, and the corresponding endurance with aerobic exercises involving the major muscle groups such as walking, running, and swimming. They concluded that exercise endurance moderately improved regeneration of the sciatic nerve and resistance training, or a combination of two strategies could delay functional recovery and did not alter regeneration of the nerve fibre. However, the protocols were applied 2 weeks after nerve injury, lasting 5 weeks.
Corroborating this study, Bobinski et al. (2011) used endurance exercise for 2 weeks, 5 times a week, with euthanasia at the end of the 4th week, to compare groups with pre- and/or postnerve injury exercise, noting improvement in nerve regeneration and limb function in the group with pre- and postinjury protocols. From this it can be assumed that the positive outcome of this study results from the relationship between exercise intensity and frequency as in previous studies, although the activity was less intense and held more frequently.
Therefore, it appears that the resistance training also showed preventive and rehabilitative effects in sciatic nerve damage, which was also due to greater neuromuscular activation and dispersion of acetylcholine receptors at the endplate, thus increasing the diameter of the neuromuscular junction (Deschenes et al., 2000; Ide et al., 2014). Changes that improve muscle condition and promote the maintenance of the effects of muscle contraction, as cited above, however, were not evaluated in this study. These limitations, along with the lack of quantification of inflammatory proteins, could corroborate nerve regeneration in the TLE group and is suggested as a topic for future study.
In conclusion, resistance exercise promotes angiogenesis and when performed alone either prior or after nerve injury was not effective at preventing or reversing the effects of nerve damage, respectively. Morphological changes occurred including a decrease in nerve fibres, diameter of axons, the thickness of the myelin sheath and the average density of nerve fibres. However, the exercise before injury alone led to a qualitative improvement of the general morphology of the tissue, with characteristics similar to those of the control group and also resulted in decreased density of cellular infiltrates. While the combination of these protocols led to improvement in nerve regeneration, due to the restoration of the diameter of the axon and qualitative improvement of tissue morphology, it did not impact axonal maturation. Despite morphological changes, exercise had no effect on functional recovery, as indicated by the SFI with a return to baseline in all injured groups.
ACKNOWLEDGMENTS
To Conselho Nacional de Desenvolvimento Científico e Tecnológico (CNPq) by scientific initiation scholarship funding.
Notes
CONFLICT OF INTEREST
No potential conflict of interest relevant to this article was reported.