


INTRODUCTION
Velichko and Zagoruyko (1970) developed dynamic time warping (DTW) to assess the similarity of speech signals with varying lengths. Then, Sakoe and Chiba (1978) optimized it by applying the dynamic programming algorithm. Subsequently, through various previous studies, it became recognized as a valuable algorithm capable of evaluating the similarity of time series data with different lengths and nonlinear patterns (Efrat et al., 2007). Due to these advantages, DTW has been applied in various research fields, including computer vision, animation, motion recognition, and online signature recognition (Gong et al., 2022; Trelinski and Kwolek, 2021). Gaspar et al. (2017) also utilized it to validate the validity of musculoskeletal model simulation studies. Regarding gait data, previous studies by Barth et al. (2015), Lee (2023), and Lee (2019) have employed DTW. The reason for using DTW for gait data is that the human gait signal is a nonlinear pattern, and there are differences in the gait cycle every time, even if the same subjects are tested, so DTW is more valuable than the previously used methods of autocorrelation and symmetry index. DTW is an algorithm designed for aligning 2-time series data, which may have different lengths, by constructing a cost matrix.
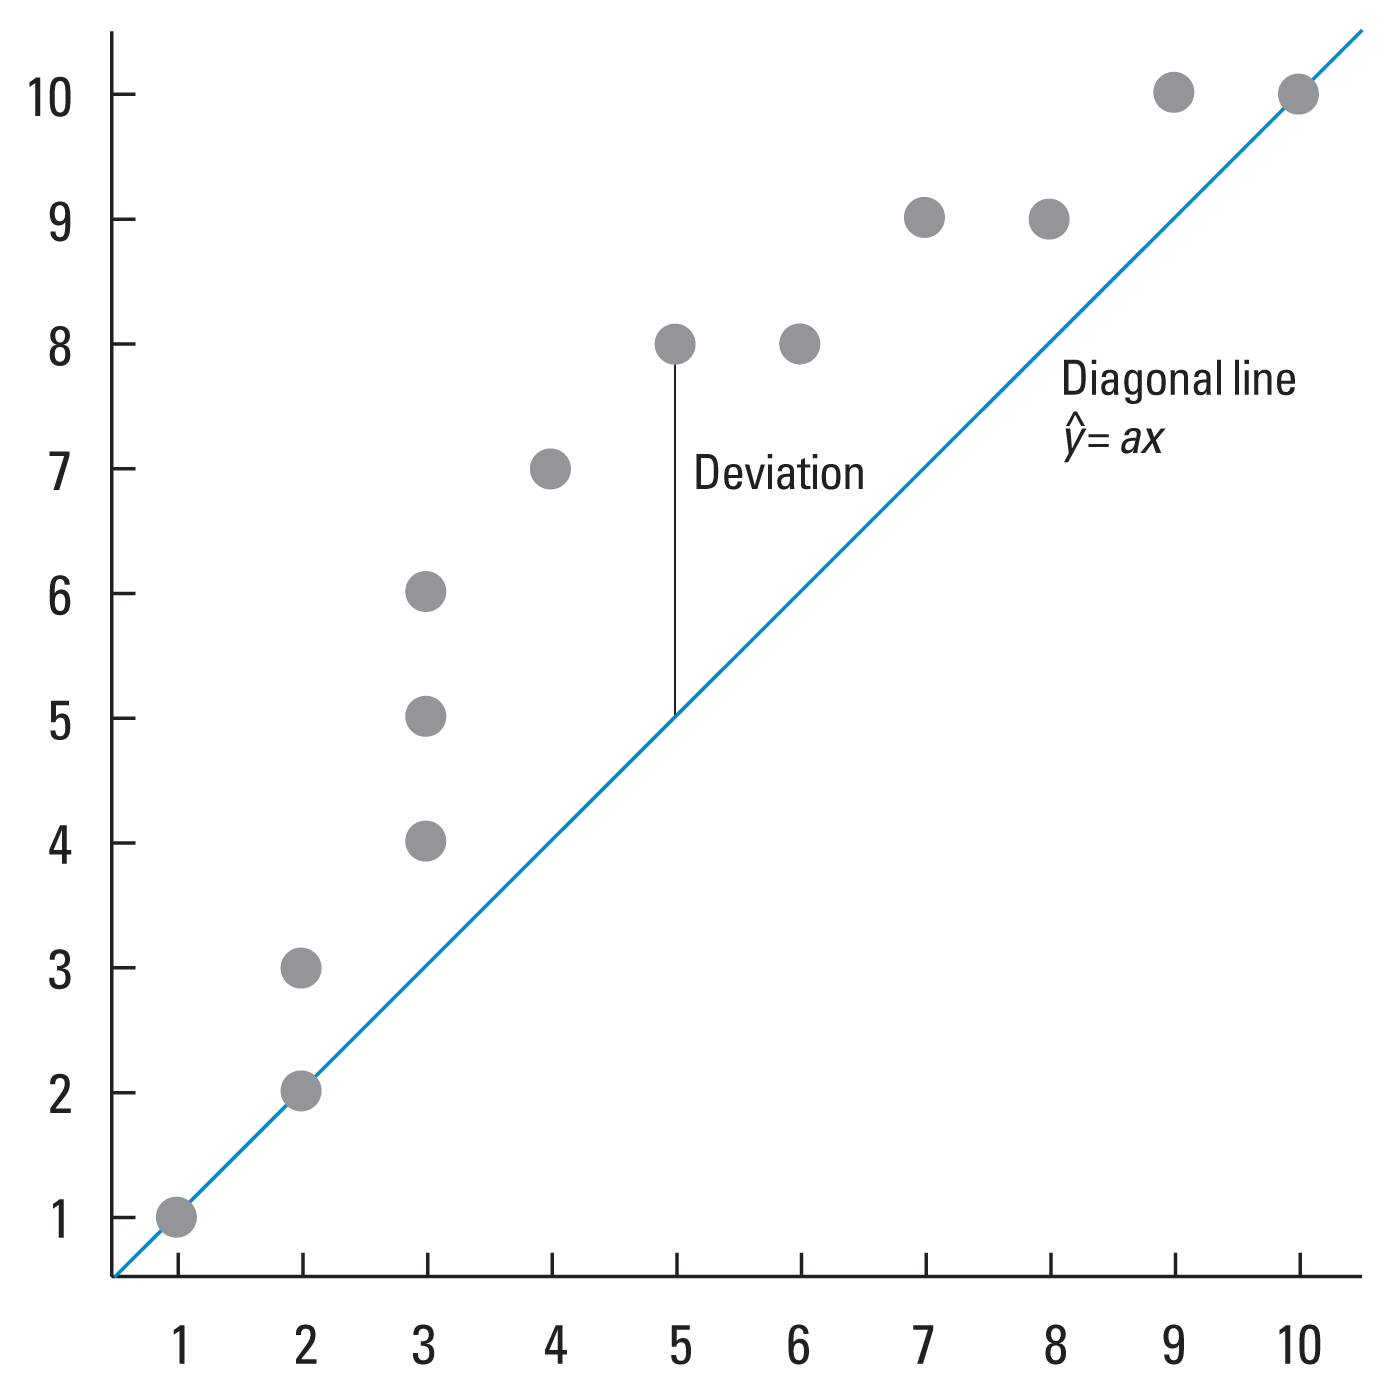
The algorithm aims to find paths that match the two sequences based on three criteria: boundary condition, monotonicity condition, and step size condition. The critical focus of the paths identified through this process is determining the optimal warping path (OWP), representing the optimal matching path. Due to differences between the time series data, multiple matching paths may emerge during this procedure. The standard method for selecting the OWP is to choose the path where the sum of local costs is minimized. If 2-time series data are perfectly identical, the OWP in the cost matrix will be diagonal. However, when there are differences between the time series data, the OWP deviates from the diagonal. When applying DTW to actual gait signals, multiple OWPs with the minimized sum of local costs can occur. Therefore, relying solely on the sum of local costs as a criterion for determining the OWP, as is the traditional method, may not provide a sufficient judgment standard. Nevertheless, most known DTW programs still determine the OWP using only the traditional method. The phenomenon of multiple OWPs has not been reported until recently. Moreover, researchers may not be aware of this possibility if researchers use the traditional method when programming the DTW algorithm. These issues not only pose constraints on various research fields, including gait studies that utilize DTW, but also can have negative implications for the reliability, validity, and accuracy of results. In particular, slight differences can lead to different results when applying DTW to the study of gait pattern similarity, which is utilized in diagnosing and rehabilitating gait-related diseases.
Thus, the method of selecting the OWP becomes crucial. Therefore, this study aims to demonstrate that, when performing DTW with gait data, multiple OWPs with minimized sum of local cost can occur. Then, we propose an additional selection method that utilizes deviations from the diagonal line in the cost matrix to choose a single OWP.
MATERIALS AND METHODS
Participants
In order to acquire gait data, a 3-dimensional (3D) motion analysis experiment was conducted with a total of 55 participants, 27 males and 28 females. Determining the sample size utilized the GPower program set at an effect size of 0.8, a significance level of 0.05, and a statistical power of 0.8 in the analysis method of independent t-test, resulting in a calculated sample size of 52. However, the sample size was adjusted to 55 for potential dropouts. Participants were healthy adults in their 20s with no professional exercise experience and no musculoskeletal disease or injury in the 3 months before the experiment. After explaining the purpose and content of the study to the participants, informed consent was obtained by the research participation agreement (KUIRB- 2021-0250-03). The anthropometric data of the participants are presented in Table 1.
3D motion analysis experiment
Participants underwent a 5-min walking practice at their self-selected speed to acclimate to the laboratory environment and alleviate any tension due to the experiment. The 3D motion analysis equipment utilized Motion Analysis’s motion capture system (6085 State Farm Drive Suite 100, Rohnert Park, CA, USA) and used ten infrared CCD cameras to enhance spatial verification and data collection accuracy for the walking path. The cameras had a sampling frequency of 120 frames per second, and the shutter speed was set at 1/1,000 sec. The obtained 3D coordinate data from the experiment underwent smoothing using a Butterworth low-pass filter. The distance corresponding to two strides of each participant was recorded 3 times, and the angle values of the hip, knee, and ankle joints were calculated. DTW was performed 990 times (55 participants×3 joints×6 strides) with each joint of the participant’s left and right foot as the comparison sequences.
Selection method of OWP
The traditional method for selecting the OWP in DTW is to choose the path with the smallest sum of local costs among those found (Blazkiewicz et al., 2021; Jeong and Baek, 2021; Sakoe and Chiba, 1978), as shown in mathematical expression 1.
Here, P represents the set of identified paths, and cp denotes the sum of local costs corresponding to the indices of each path. However, this method becomes impractical when paths have the same sum of local costs. Therefore, in this study, we propose the following additional method. If two sequences are identical in DTW, the OWP becomes the diagonal line in the cost matrix. In other words, the most ideal OWP in DTW is the diagonal line. Using this as a reference, we calculate the deviation to the diagonal line for paths with the same sum of local costs, and the OWP is selected based on the path with the smallest sum of these deviations. Expressing this mathematically, it can be represented by mathematical expressions 2 and 3.
Here, (yxi)op represents the y index corresponding to the x index of each path with a potential to be the OWP (minimizing local cost sum).
Σ ( ( y x i ) o p - y ^ ) 2
In this study, a DTW program incorporating the expression mentioned above was developed using the R-language. The results were cross-validated to ensure the program’s validity by comparing them with the DTW package available in R (Giorgino, 2009), confirming their congruence. Conducting 990 DTW analyses on gait data, we investigated the occurrence of multiple OWPs and analyzed the feasibility of determining a single OWP using the expression above.
RESULTS
When conducting DTW between the left and right feet using gait data, instances of multiple OWPs with minimized local cost sum are presented, as shown in Table 2. Among the 990 DTW executions, instances of multiple OWPs occurred 82 times, accounting for 8.28%. Particularly, when focusing on the ankle joint of males, the rate was the highest at 11.11%. Table 3 illustrates the distribution of the number of multiple OWPs, showing that cases with two multiple OWPs were the most prevalent at 56.10%, and instances with 10 or more multiple OWPs accounted for 19.51%. These results indicate a considerable likelihood of multiple OWPs with minimized local cost during DTW execution and, in some cases, a substantial number of such paths. Notably, the maximum number of multiple OWPs in this study was 51. Therefore, using the traditional method for selecting the OWP raises uncertainty about whether the identified path is truly OWP. Moreover, researchers may remain unaware of this uncertainty when using conventional DTW programs, as these programs only output the result values.
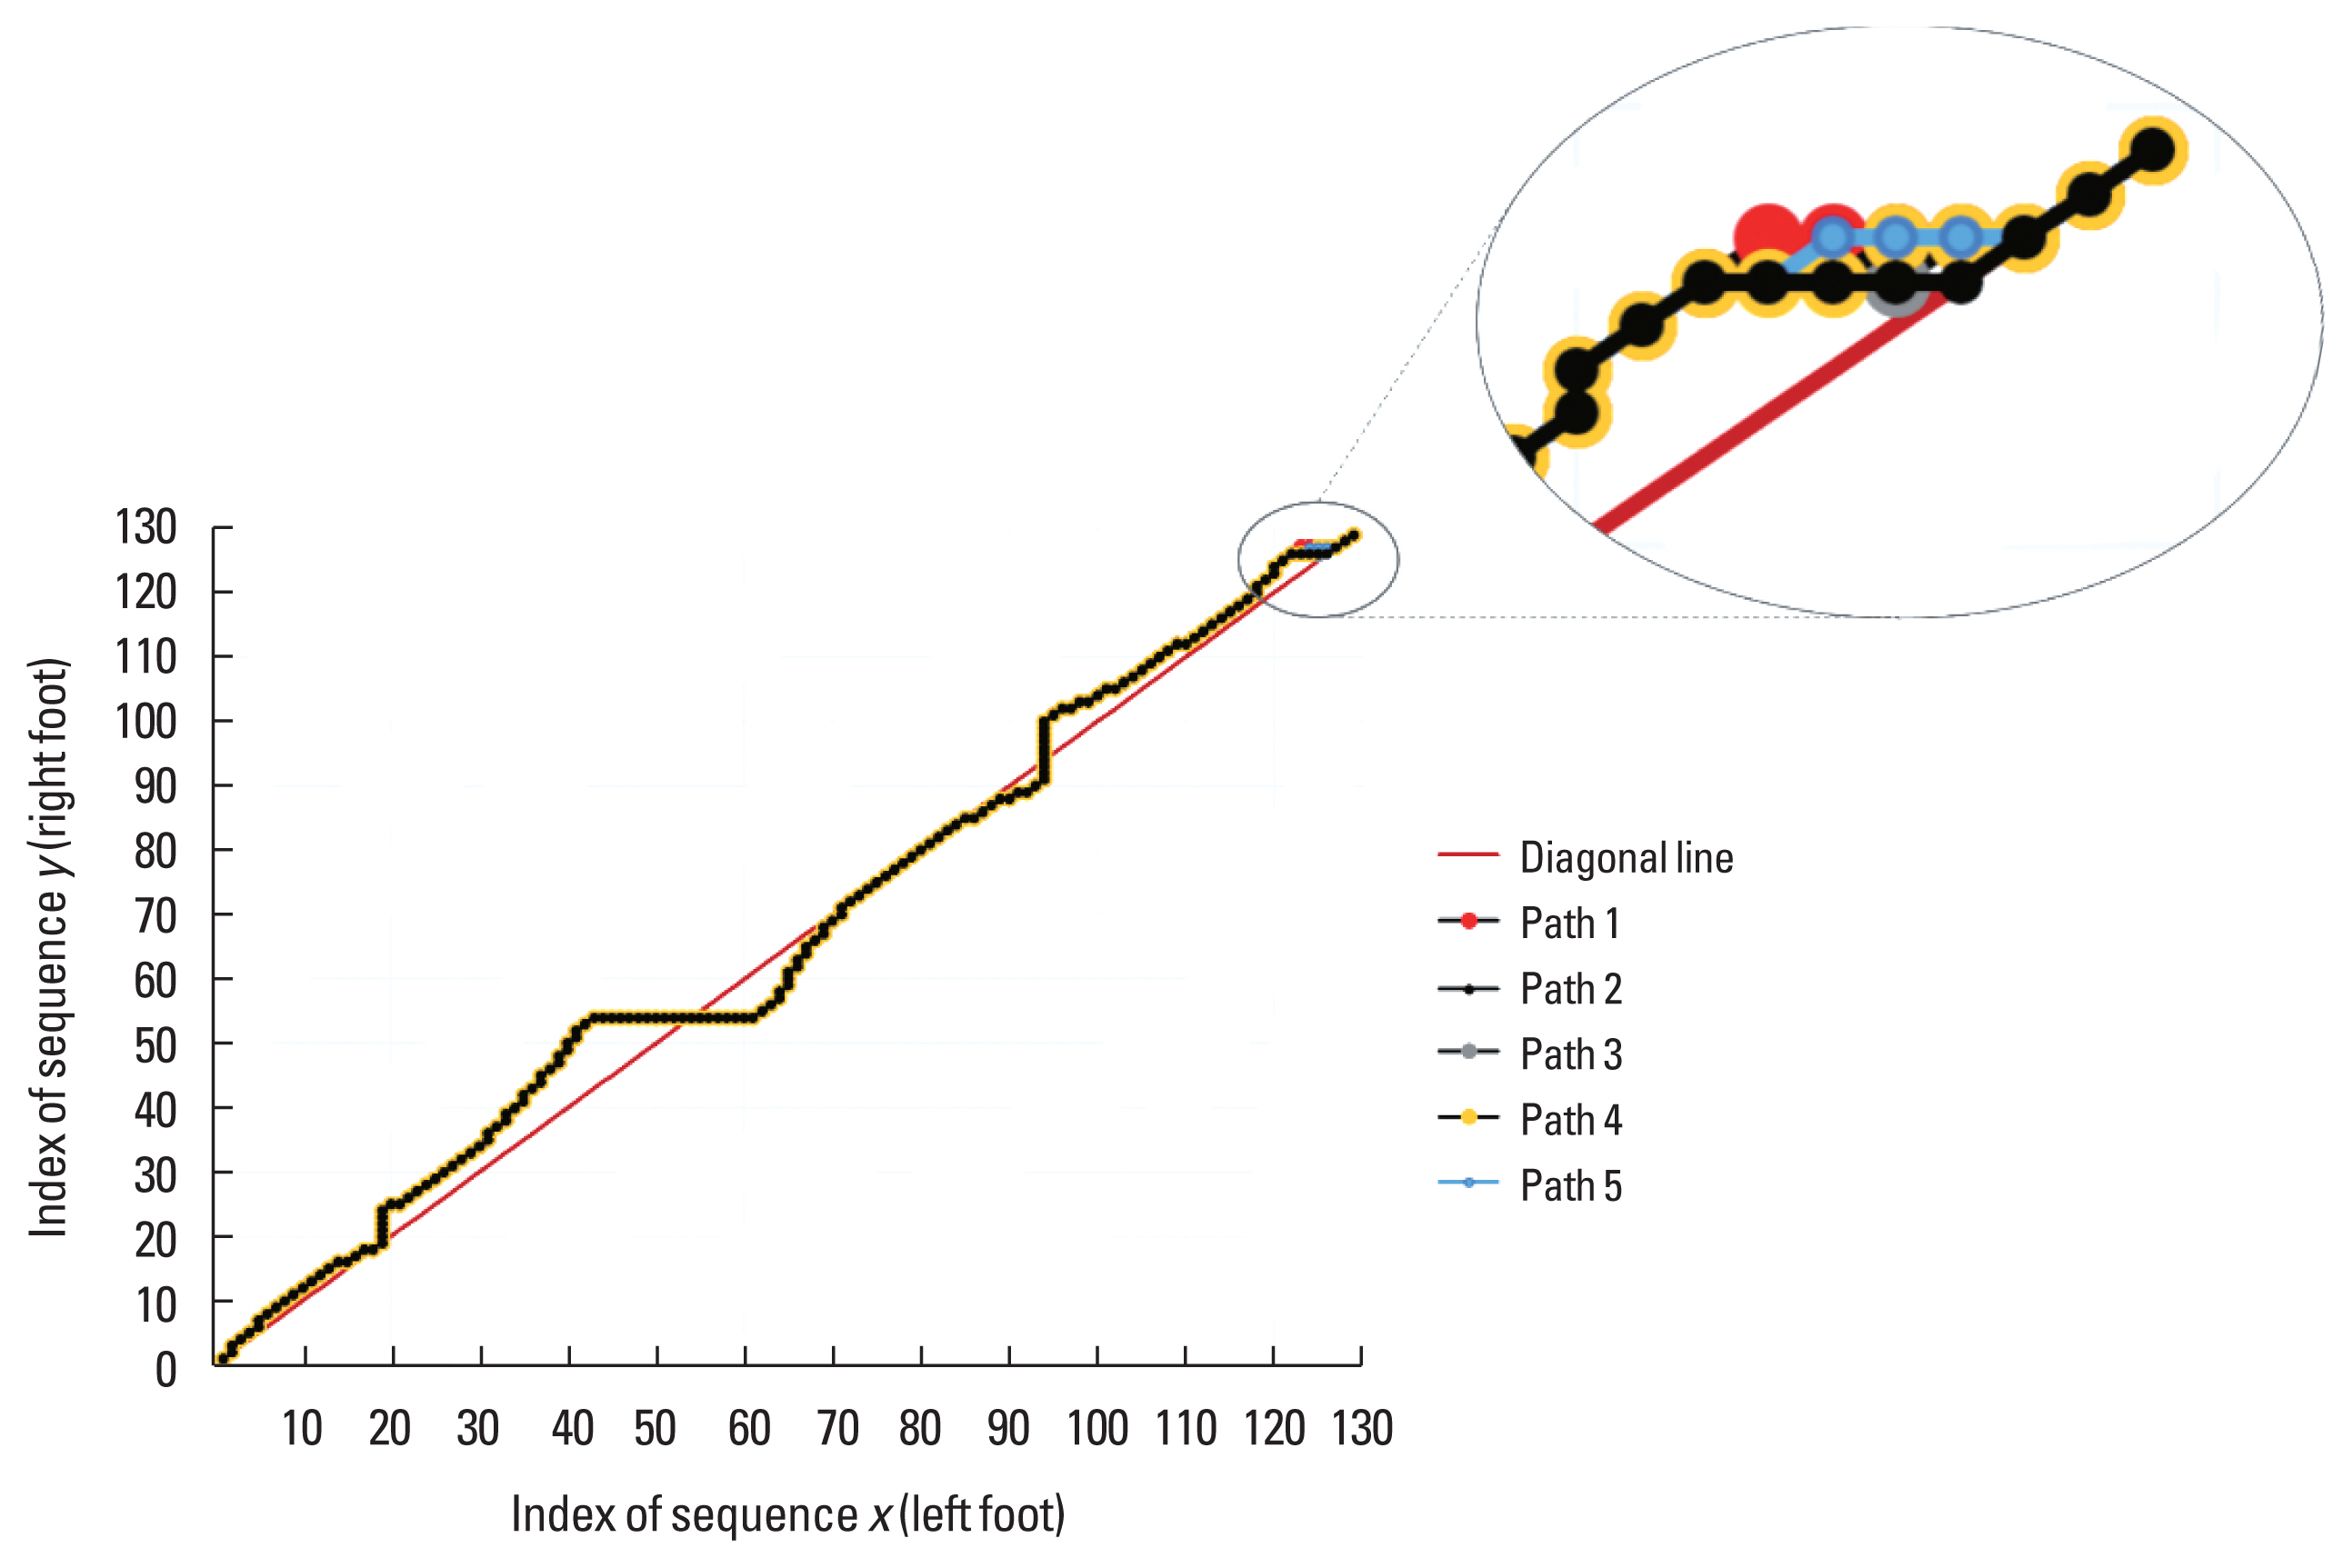
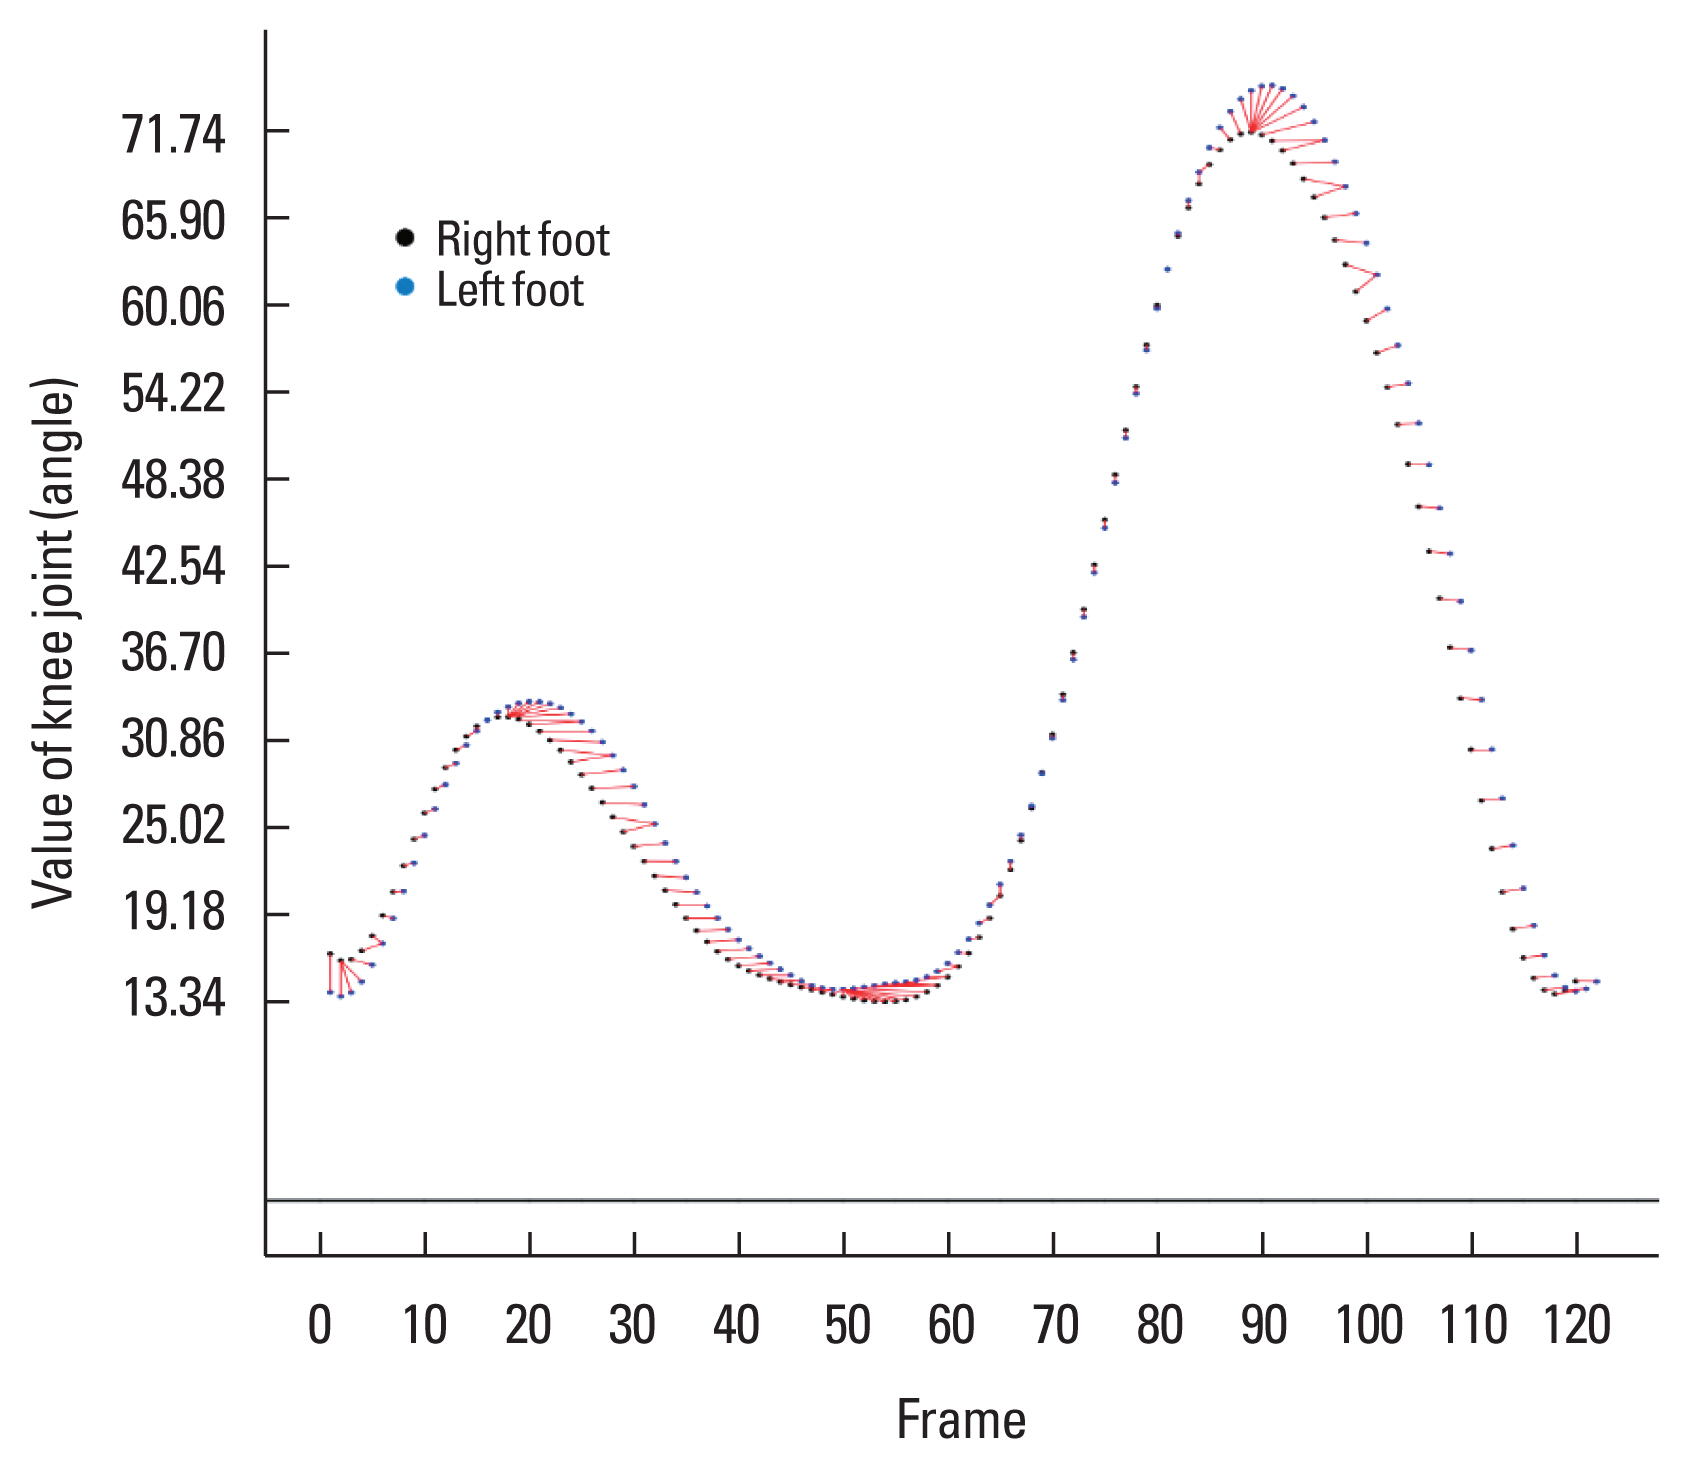
For the 82 cases where multiple OWPs occurred, executing the additional selection method proposed in the research methodology resulted in finding a unique OWP in all instances. Moreover, after applying the additional selection method, the issue of multiple OWPs did not reoccur. Table 4 illustrates an example of cases where multiple optimal paths occurred when performing DTW on the knee joint of females and applying the additional selection method. In this scenario, the cost matrix is square, resulting in 5 optimal paths based on the sum of local costs. The path index lengths of these paths were identical. Calculating the deviations to the diagonal line, the second path among the five optimal paths was analyzed to have the smallest deviation to the diagonal line, measuring 0.031729. Fig. 2 displays the raw data and the matching state, while Fig. 3 presents the five optimal paths. The black circular mark, representing the second optimal path chosen in this study, is observed to be close to the diagonal line.
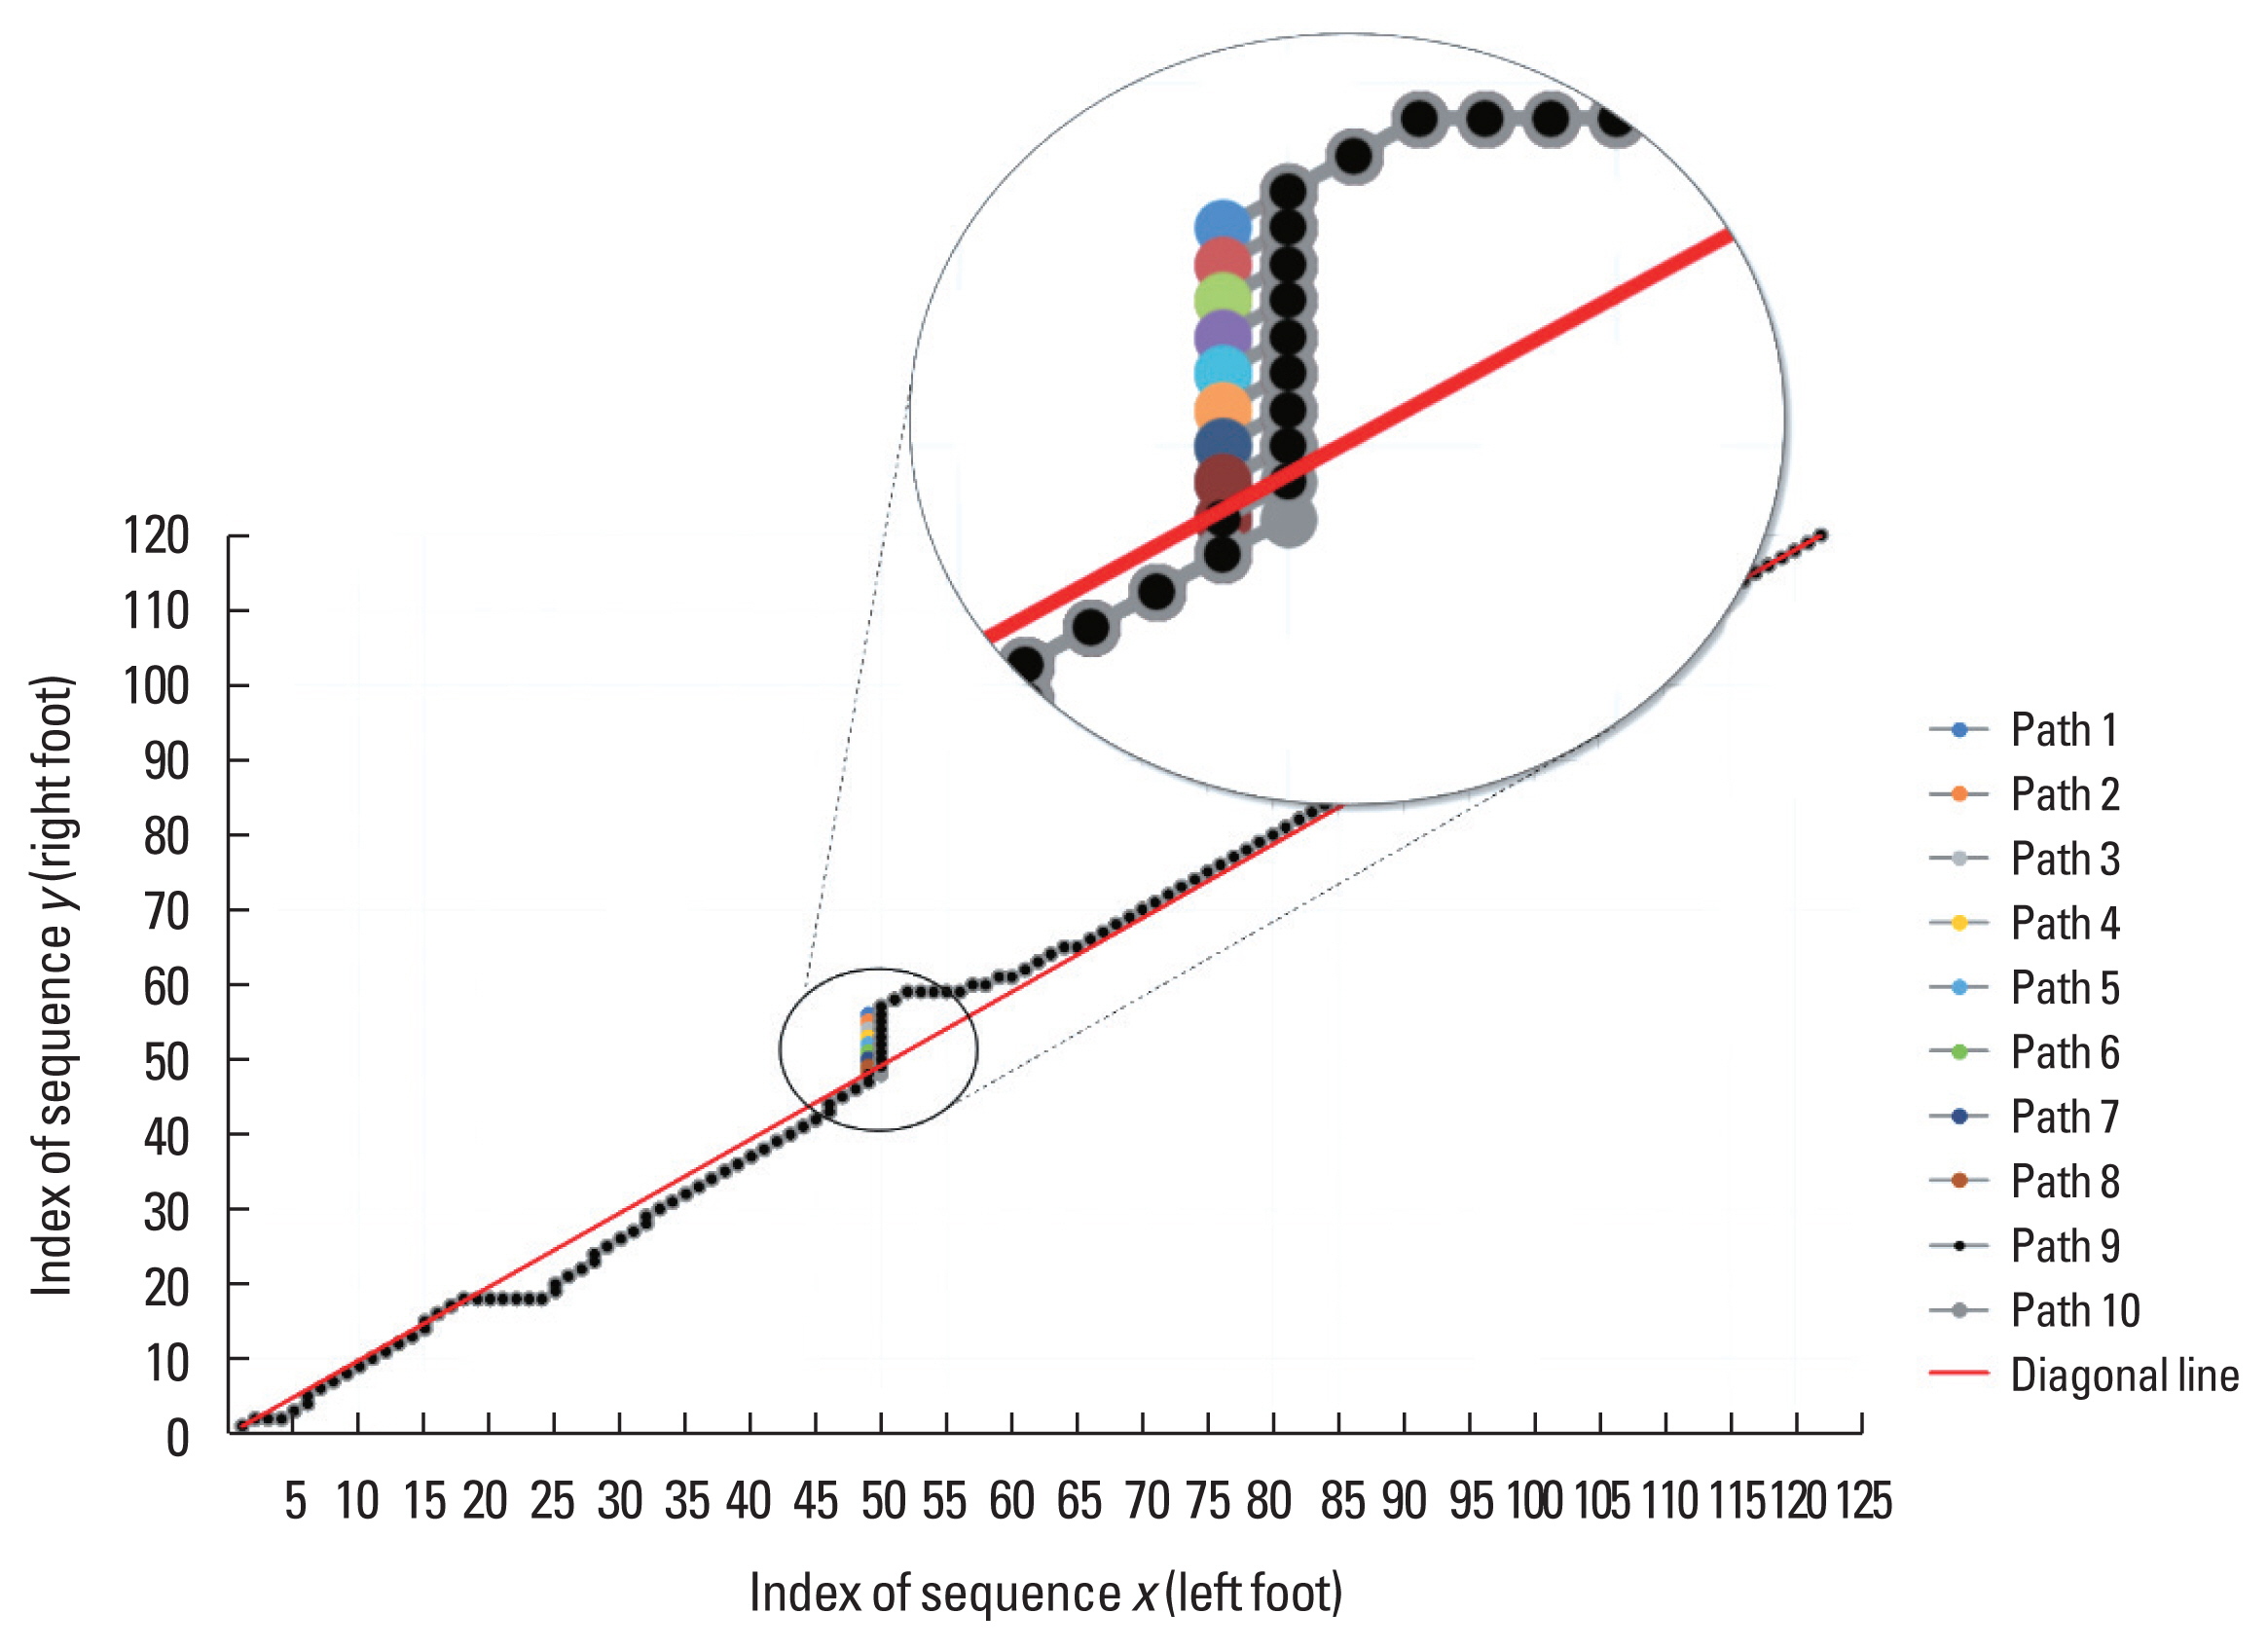
Table 5 also presents another representative example of multiple OWPs on the knee joint of females when DTW is applied. In this case, the cost matrix is non-square, resulting in 10 optimal paths based on the sum of local costs. Upon calculating the deviations to the diagonal, the ninth path was identified with the smallest deviation of 0.019025. Fig. 4 illustrates the raw data and matching status, while Fig. 5 depicts the multiple optimal paths. The final selection, marked by the black circular symbol, aligns closely with the diagonal.
DISCUSSION
This study confirmed through analysis that when performing DTW on gait data using only the sum of local costs for optimal path selection, multiple OWPs can arise. Additionally, when multiple OWPs occur, the study demonstrated that an additional selection method can be employed, utilizing the deviations of each of the multiple OWPs from the diagonal line to choose a single, ultimate optimal path. Results in this study are significant as they highlight the limitations of the traditional optimal path selection method and propose a solution. These findings also contribute to enhancing the reliability, validity, and accuracy of studies utilizing DTW.
Upon reviewing prior studies, DTW was the primary analytical tool to resolve intricate research problems across various domains. The relevant studies include the following: robotics and human gait recognition, and gait characteristics of elderly patients (Gong et al., 2022; Ma et al., 2022), investigations into the assessment of motor function in stroke patients, and the analysis of gait differences when wearing ankle orthoses (Blazkiewicz et al., 2021; Li et al., 2021), as well as the application of DTW to classification moderate and mild illness using the voices of coronavirus disease 2019 patients (Watase et al., 2023). Studies that have utilized DTW as an additional analytical tool in conjunction with other analytical methods include the following: Ghersi et al. (2020) proposed a system combining DTW to automatically extract and analyze gait cycles from lower limb acceleration signals, Dot et al. (2020) conducted study utilized DTW on detecting gait events from signals recorded by a gyrometer, and Li et al. (2019) reported on the statistical differentiation between stroke patients and healthy subjects using the DTW algorithm and sample entropy method. Studies aimed at enhancing the performance of DTW rather than utilizing it as an analysis tool include the following: Xu et al. (2023) introduced that the classification accuracy of C-DTW is higher than that of DTW. Zhang et al. (2017) proposed LDTW algorithm restricting the total alignment count of DTW to achieve superior alignment results. Shokoohi-Yekta et al. (2017) reported a method to enhance classification accuracy in time series data mining, and Lee (2023) proposed a method of optimizing the normalization of optimal paths to increase the effectiveness of machine learning classification analyses using DTW.
As observed in the studies above, most have employed DTW as a primary analytical tool or an auxiliary tool to solve research problems and enhance its functionality. However, these studies have yet to report on the occurrence of multiple OWPs during the primary objective of DTW, which is the decision of OWP. The occurrence of multiple OWPs is variable according to the utilized data. Furthermore, when the DTW was programmed in its original algorithm, detecting the existence of multiple OWPs would have been difficult because a single OWP had always been produced. When researchers make the DTW program themselves without information about the potential occurrence of multiple OWPs, the programming code may be composed incompletely without solving code about the occurrence of multiple OWPs. An incomplete DTW program could have a potentially negative impact on the validity and reliability of the research. In this regard, the results of this study not only address the limitations of DTW but also contribute to more accurate research execution. In gait research, DTW has been used to identify abnormal movements by comparing a patient’s gait pattern to a standard gait pattern, and in sports, it has been utilized to compare sports skill patterns to improve specific sports skills. It is also being used to evaluate the effectiveness of treatments and patient progress in rehabilitation for athletes and the general population. As DTW is used as a tool for comparison and diagnosis in exercise and rehabilitation, the results obtained by DTW analysis should be valid and reliable. In this regard, the results of this study will help further strengthen the reliability and validity of DTW analyses in the field of exercise and rehabilitation. Additionally, by proposing an additional method for selecting a single OWP to address the occurrence of multiple optimal paths, this study is expected to assist future researchers who aim to utilize DTW by programming for research purposes.
While this study exclusively utilized gait data, considering the widespread and active application of DTW in medical and rehabilitation fields, as well as various research domains, it is conceivable that similar studies may be conducted in each domain to investigate the occurrence of multiple optimal paths in the data handled in those studies. The results of this study should also lead to caution when using DTW programs written or distributed by other researchers.