


INTRODUCTION
During adolescence, a crucial phase of human development unfolds, marked by rapid psychological and biological changes (van Sluijs et al., 2021). This period could be the most important period for human health throughout the next generation (van Sluijs et al., 2021). Regularly performed physical activity (PA) has been known to be vital for proper growth of adolescents. Moreover, performing PA during adolescence has been associated with positive physical and mental health throughout different stages of life (Batista et al., 2019; Silva et al., 2022).
Studies focusing on the adolescents have demonstrated a positive correlation between higher levels of moderate to vigorous PA and beneficial effects on bone strength, cardiorespiratory fitness, blood pressure, lipid profile, and insulin sensitivity (Farooq et al., 2020). Low level of PA has been negatively associated with physical and mental health in adolescents and in turn, adulthood (Rodriguez-Ayllon et al., 2019; Zou et al., 2023). Although regularly performed daily PA is recommended for healthy development and mind and body, the amount of PA performed has been reported to decrease with age in adolescents of many different countries (Farooq et al., 2018; Janz et al., 2014). Many experts promote PA during young age since exercise habit is one of the major factors in continuing PA and delaying comorbidities related to sedentary lifestyle throughout the adulthood (Batista et al., 2019; Bélanger et al., 2015; Silva et al., 2022).
Insufficient amount of PA in adolescents has been reported in many countries including Korea (Ferrari et al., 2020; Oh et al., 2019). Reasons could be multifactorial, including increased duration for college preparation and career development. In addition to previous multifactorial reasons, pandemic situation lowered prevalence of PA in adolescents in Korea (Lee et al., 2023). Many experts have expressed concerns over lack of PA among Korean adolescents (Lee et al., 2023; Seo et al., 2022). Seo et al. (2022) reported of insufficient PA in 94.1% of the Korean adolescents in 2020. Transitional patterns of PA behavior over time during different stages of adolescent has been analyzes in previous studies (Batista et al., 2019; Ferrari et al., 2020; Haverkamp et al., 2020). Prior studies have established that the overall level of PA tend to decline with age and such trend could lead to similar PA behavior throughout the adulthood (Lounassalo et al., 2019). To encourage PA during adulthood, it is crucial to comprehend the patterns of PA during various stages of growth. Decrease in PA in Korean adolescents have been previously reported. However, changes in the amount and intensity of PA for each grade level and the relationship to mental state and academic performance have not been clearly elucidated.
Therefore, this study was prepared to observe the changes in the amount of regularly performed moderate and vigorous PA of middle and high school adolescent boys in Korea. Only boys were considered for this study because how boys and girls perceive of PA and reasons for either PA or inactivity have been reported to be different (Lago-Ballesteros et al., 2021). This study also observed mental health state and academic performance in relationship to PA for each grade.
MATERIALS AND METHODS
The present research utilized data of the 18th Korea Youth Risk Behavior Survey (KYRBS), a comprehensive nationwide survey capturing the health status of Korean youth (Korea Disease Control and Prevention Agency, 2022). The Youth Risk Behaviors Web-based Survey was carried out subsequent to the Medical Research Ethics Review Committee at the Korea Centers for Disease Control and Prevention (KCDC)’s review and approval of the scales and investigative procedures used to ensure ethical treatment of the participants. All participants provided prior consent before the data collection process. Starting from 2015, the Institutional Review Board of the KCDC has exempted the requirement for KYRBS ethical approval in accordance with the Bioethics & Safety Act. Consequently, the survey results have been accessible to the public for academic purposes.
The 18th survey covered various aspects including nutrition, mental health, sedentary and PA lifestyle. The primary objective of KYRBS is to gather essential data for designing and assessing health promotion initiatives targeted adolescents in Korea. The Korea Disease Control and Prevention Agency (KDCA) conducts this anonymous online questionnaire targeted at middle and high school students. The teacher overseeing the survey directed a sample class to a computer room with internet access and randomly assigned each student to a computer. The entire survey process lasted for 45 to 50 min. Upon completion, the teacher recorded the number of participated and non-participated students. This information was then registered online during the investigation, and these data were subsequently used to calculate the survey’s weighting. The KYRBS encompassed 114 questions and 101 indicators, collected between August and October 2022. To ensure a representative sample of Korean adolescents, a complex sampling method was employed, involving stratification, cluster, and multilevel sampling. Each sample was assigned a weight to accurately represent the Korean adolescent population. To mitigate biased results, the composite sample design was used, and values were calculated using the weighted average.
The survey was conducted with 51,850 students from 798 schools out of initially expected 56,213 students from 400 middle schools and 400 high schools. The participation rate, based on the number of students, was recorded at 92.2%. The subject count pertains to the number of students who were absent on the day of the survey. From the sample class students, those with long-term absenteeism, special needs preventing independent participation in the survey, and students with reading disabilities were excluded from the study. The Korea Youth Risk Behavior Survey was carried out following a thorough review and approval by the Medical Research Ethics Review Committee from the KCDC. This review assessed the scales and investigation process used, ensuring ethical consideration for all participants. Before data collection, prior consent was obtained from every participant. This study selected 8 questions for analyses.
Measures
The school type and the grade levels were indicated as first year (M1), second year (M2), and third year (M3) middle school or first year (1H), second year (2H), and third year (3H) high school. Out of 51,850 male subjects participated in survey, 26,397 were initially selected for the study after the selection criteria process. First, selected 26,397 male subjects were distribution ratio by grades of M1, M2, M3, H1, H2, and H3 were 18.0%, 17.9%, 17.8%, 16.0%, 15.8%, and 14.4%. To exclude the effect of possible participation of PA for major as athletic or career, the subjects who answered reason for PA participation as college preparation or entrance were excluded. In addition, extreme outliers were also excluded. After the exclusion selection process, 16,394 male adolescents were selected for the study with ratio of grades M1, M2, M3, H1, H2, and H3 of 19.7%, 19.5%, 19.1%, 15.8%, 14.8%, and 11.0%.
The variables included days of PA participation of more than 60 min, hours of moderate and vigorous PA participation, loneliness felted during recent year, and subjective academic performance. The ages of M1, M2, M3, H1, H2, and H3 were 13, 14, 15, 16, 17, and 18 years old. Each grade level was further compared by the amount of regularly performed PA: sedentary group (SG) and physical activity group (PG). The amount of PA was analyzed based on various questionnaires. First, perceived frequency of regularly performed PA was measured using the question, “Over the past 7 days, on how many days did you do more than 60 min of PA (regardless of type) that caused your heart rate to increase more than usual or make you short of breath?” Response options were, (1) none for recent 7 days, (2) 1 day per week, (3) 2 days per week, (4) 3 days per week, (5) 4 days per week, (6) 5 days per week, (7) 6 days per week, (8) 7 days per week. The subjects who performed 2 or less days of PA were included in the SG and the participants who performed 3 days or more were included in the PA.
This questionnaire was further analyzed for the intensity of PA using the questions as follows. As for vigorous intensity PA, “During the last 7 days, if you did any high-intensity PA that made you breathless or sweaty, on average, how much did you do high-intensity PA per day?” The responders wrote down the amount of PA in minutes. As for moderate-intensity PA, “For the past 7 days, if you did moderate-intensity PA that made you slightly short of breath than usual, how much did you do on average per day during those days?” The responder wrote the amount of PA in minutes. Reasons for conducting PA were acquired through question “What is the biggest reason you do exercise or PA?” Response options were, (1) for health, such as physical fitness, (2) for fun, (3) to relieve stress, (4) to grow muscles, (5) to lose weight, (6) recommended by a teacher(s), (7) recommended by a family member(s) such as a parent(s) and/or sibling(s), (8) to play with peers, (9) for college or managing grades, (10) others.
Majority of globally renowned organizations related to health promotion recommend more than 60 min of PA daily. To observe the prevalence of PA, prevalence rate of PA by days of PA was observed. The degree of sedentary behavior was analyzed by sitting time (ST). First the duration of ST for the purposes of study and other than study was acquired through question, “Over the past 7 days, on average, how many hours per day did you spend sitting?” The responders wrote down the duration of ST for the purpose of study and for the purpose of nonstudy. The degree of subjective academic performance (grade) was acquired through question “In the last 12 months, how was your academic performance?” Response options were, (1) high, (2) middle-high, (3) middle, (4) low-middle, (5) low. The degree of loneliness (Lone) was acquired through question, “In the last 12 months, how often have you felt lonely?” Response options were, (1) not at all, (2) almost, (3) sometimes, (4) often, (5) always. Degree of stress (Stress) was also acquired through question, “How much stress do you usually feel?” The response options were, (1) not at all, (2) almost, (3) sometimes, (4) often, (5) always.
Statistical analysis
Following the analytical guidelines of the KDCA, all analyses were performed using IBM SPSS Statistics ver. 26.0 (IBM Co., Armonk, NY, USA) using the raw data from the 18th Youth Health Behavior Survey with a significance level of 0.05 applied for hypothesis testing. To ensure representation of the national samples, complex sample weights were applied. The raw data from the 18th KYRBS provided integrated strata, cluster variables, weights, and finite population correction factors to ensure population representativeness for accurate statistical analysis.
To analyze the differences in PA level by SG and PG and by grade levels (M1: 1st grade in middle school, M2: 2nd grade in middle school, M3: 3rd grade in middle school, H1: 1st grade in high school, H2: 2nd grade in high school, and H3: 3rd grade in high school), one-way analysis of variance was used was used as the primary statistical analysis. The 0.05 level was selected for the F significance. Post hoc tests were conducted using Bonferroni analysis. Moderate physical activity (MPA) duration and vigorous physical activity (VPA) duration was also analyzed between SG and PG and by grade levels as well as ST, degree of loneliness (lone), subjective academic performance or grade (grade), and degree of stress (stress) were additionally calculated with same statistical methods.
RESULTS
To observe the patterns of PA in adolescents, the participants were divided into the SG (<3 days/wk) and PG (3 or more days per week) based on the days of PA performed more than 60 min a day and days per week. Body mass index of SG and PG were 22.20±4.16 kg/m2 and 22.21±3.91 kg/m2 without significance between the groups (P=0.72), respectively.
Moderate and vigorous PA comparisons
The amount of moderate and vigorous PA was compared with percent differences between SG and PG by the grade levels of M1, M2, M3, H1, H2, and H3 as shown on Tables 1 and 2.
The weekly amount of moderate PA in SG significant decreased in H1 (219.50±284.10 min/wk, *P<0.01) and H2 (213.50± 279.21 min/wk, *P<0.01) in comparison to M1 (287.21±486.35 min/wk). Significant reductions were observed in all grade levels of M1, M2, M3, H1, H2, H3 between SG and PG with the total percent differences of 37.6% (*P<0.01), 43.3% (*P<0.01), 47.4% (*P<0.01), 53.6% (*P<0.01), 66.1% (*P<0.01), and 64.5% (*P<0.01), respectively.
As for the weekly amount of vigorous PA in SG, significant decreases were observed in H1 (239.69±264.69 min/wk, *P<0.01), H2 (221.75±298.66 min/wk, *P<0.01), and H3 (228.51±259.77 min/wk, *P<0.01) in comparison to M1 (346.04±514.07 min, *P<0.01). Significant reductions were observed in all grade levels of M1, M2, M3, H1, H2, H3 between SG and PG with the total percent differences of 43.3% (*P<0.01), 55.9% (*P<0.01), 59.9% (*P<0.01), 69.5% (*P<0.01), 82.9% (*P<0.01), and 86.6% (*P<0.01), respectively.
Sitting duration
Weekly sitting duration of moderate and vigorous PA of the groups were analyzed with percent differences by each grade levels (Table 3).
The sitting duration for study purpose of SG showed significantly increased as the grade level increased in comparison to M1 (481.64±319.72 min/wk). The sitting duration for M2, M3, M4, H1, H2, and H3 were 520.74±319.76 min/wk (*P=0.01), 555.71±337.06 min/wk (*P<0.01), 701.87±390.36 min/wk (*P<0.01), 693.92±396.48 min/wk (*P<0.01), and 744.95± 470.27 min/wk (*P<0.01).
The sitting duration for study purpose of PG also showed significantly increased as the grade level increased in comparison to M1 (515.46±313.74 min/wk) (Table 4). The sitting duration for M2, M3, M4, H1, H2, and H3 were 567.31±333.98 min/wk (*P<0.01), 553.24±335.95 min/wk (*P=0.01), 705.89±397.15 min/wk (*P<0.01), 704.91±400.72 min/wk (*P<0.01), and 629.29±437.57 min/wk (*P<0.01).
Significantly lower sitting durations were observed in the grade levels of M1 (481.64±319.72 vs. 515.46±313.74 min/wk, *P< 0.01), M2 (520.74±319.76 vs. 567.31±333.98 min/wk, *P<0.01), and H3 (744.95±470.27 vs. 629.29±437.57 min/wk, *P<0.01) in SG in comparison to PG.
The total sitting duration for nonstudy purpose of SG showed significantly decreased in H1, H2, and H3 in comparison to M1 (541.81±357.11 min/wk) (Table 4). The sitting duration for H1, H2, and H3 were 496.20±328.58 min/wk (*P<0.01), 503.29± 328.52 min/wk (*P=0.01), and 493.34±346.53 min/wk (*P< 0.01), respectively.
The total sitting duration for nonstudy purpose of PG showed significantly decreased in H1 and H2 in comparison to M1 (480.29± 304.88 min/wk). The sitting duration for H1 and H2 were 446.55± 281.45 min/wk (*P=0.01) and 451.10±344.38 min/wk (*P= 0.04), respectively.
Significantly higher sitting durations were observed in the grade levels of M1 (541.81±357.11 vs. 480.29±304.88 min/wk, *P< 0.01), M2 (548.19±345.18 vs. 498.64±300.09 min/wk, *P<0.01), M3 (551.99±341.59 vs. 497.48±299.97 min/wk, *P<0.01), H1 (496.20±328.58 vs. 446.55±281.45 min/wk, *P<0.01), and H2 (503.29±328.52 vs. 451.10±293.96 min/wk, *P<0.01) in SG in comparison to PG.
Subjective academic performance (grade)
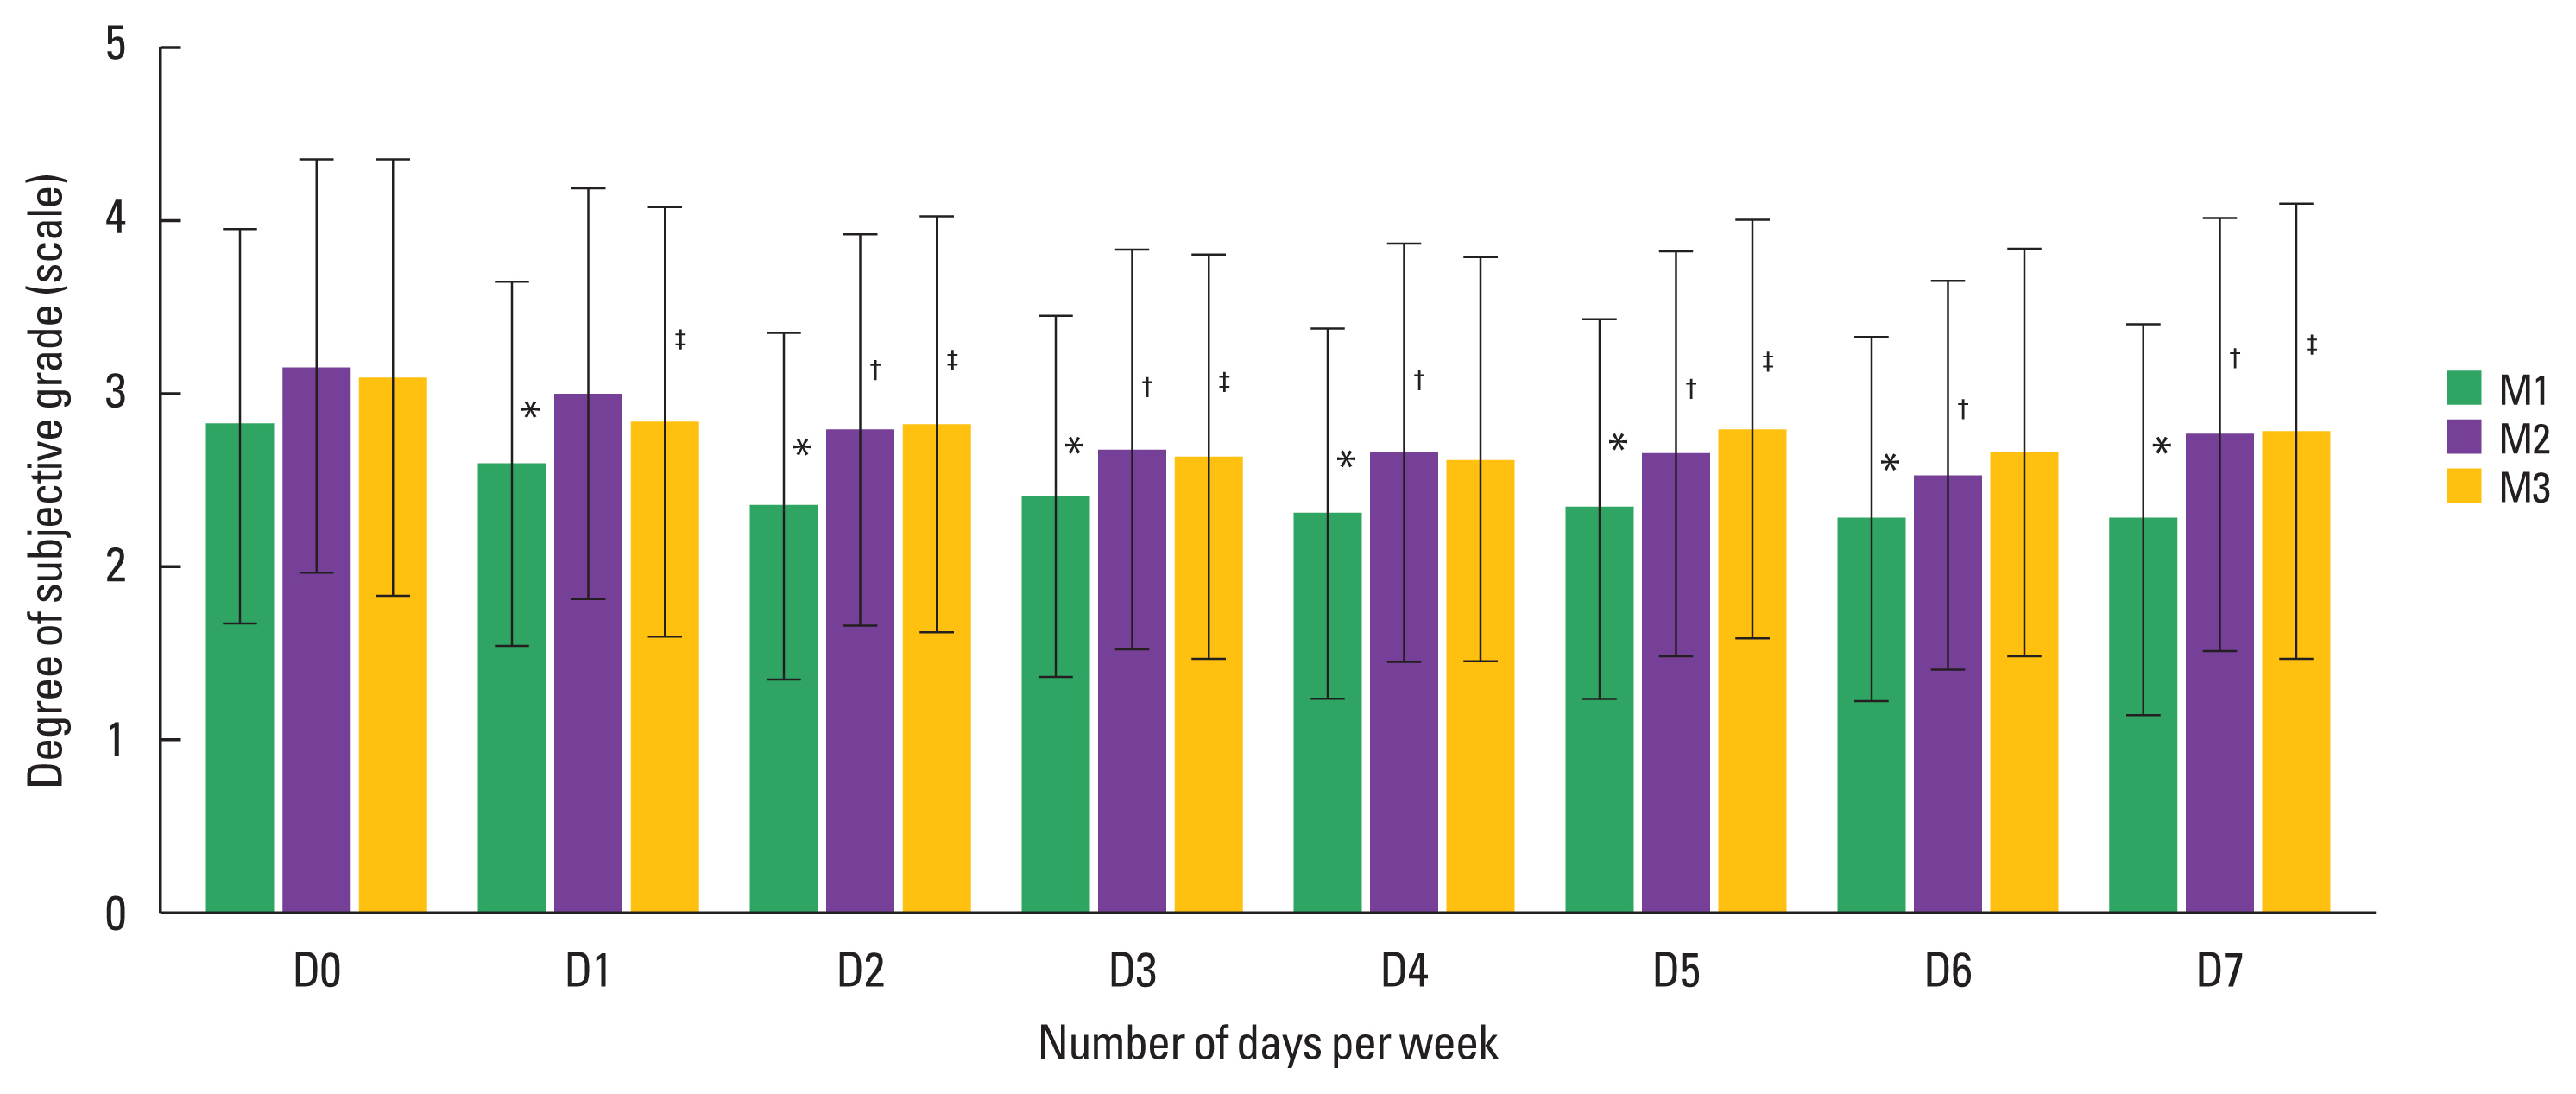
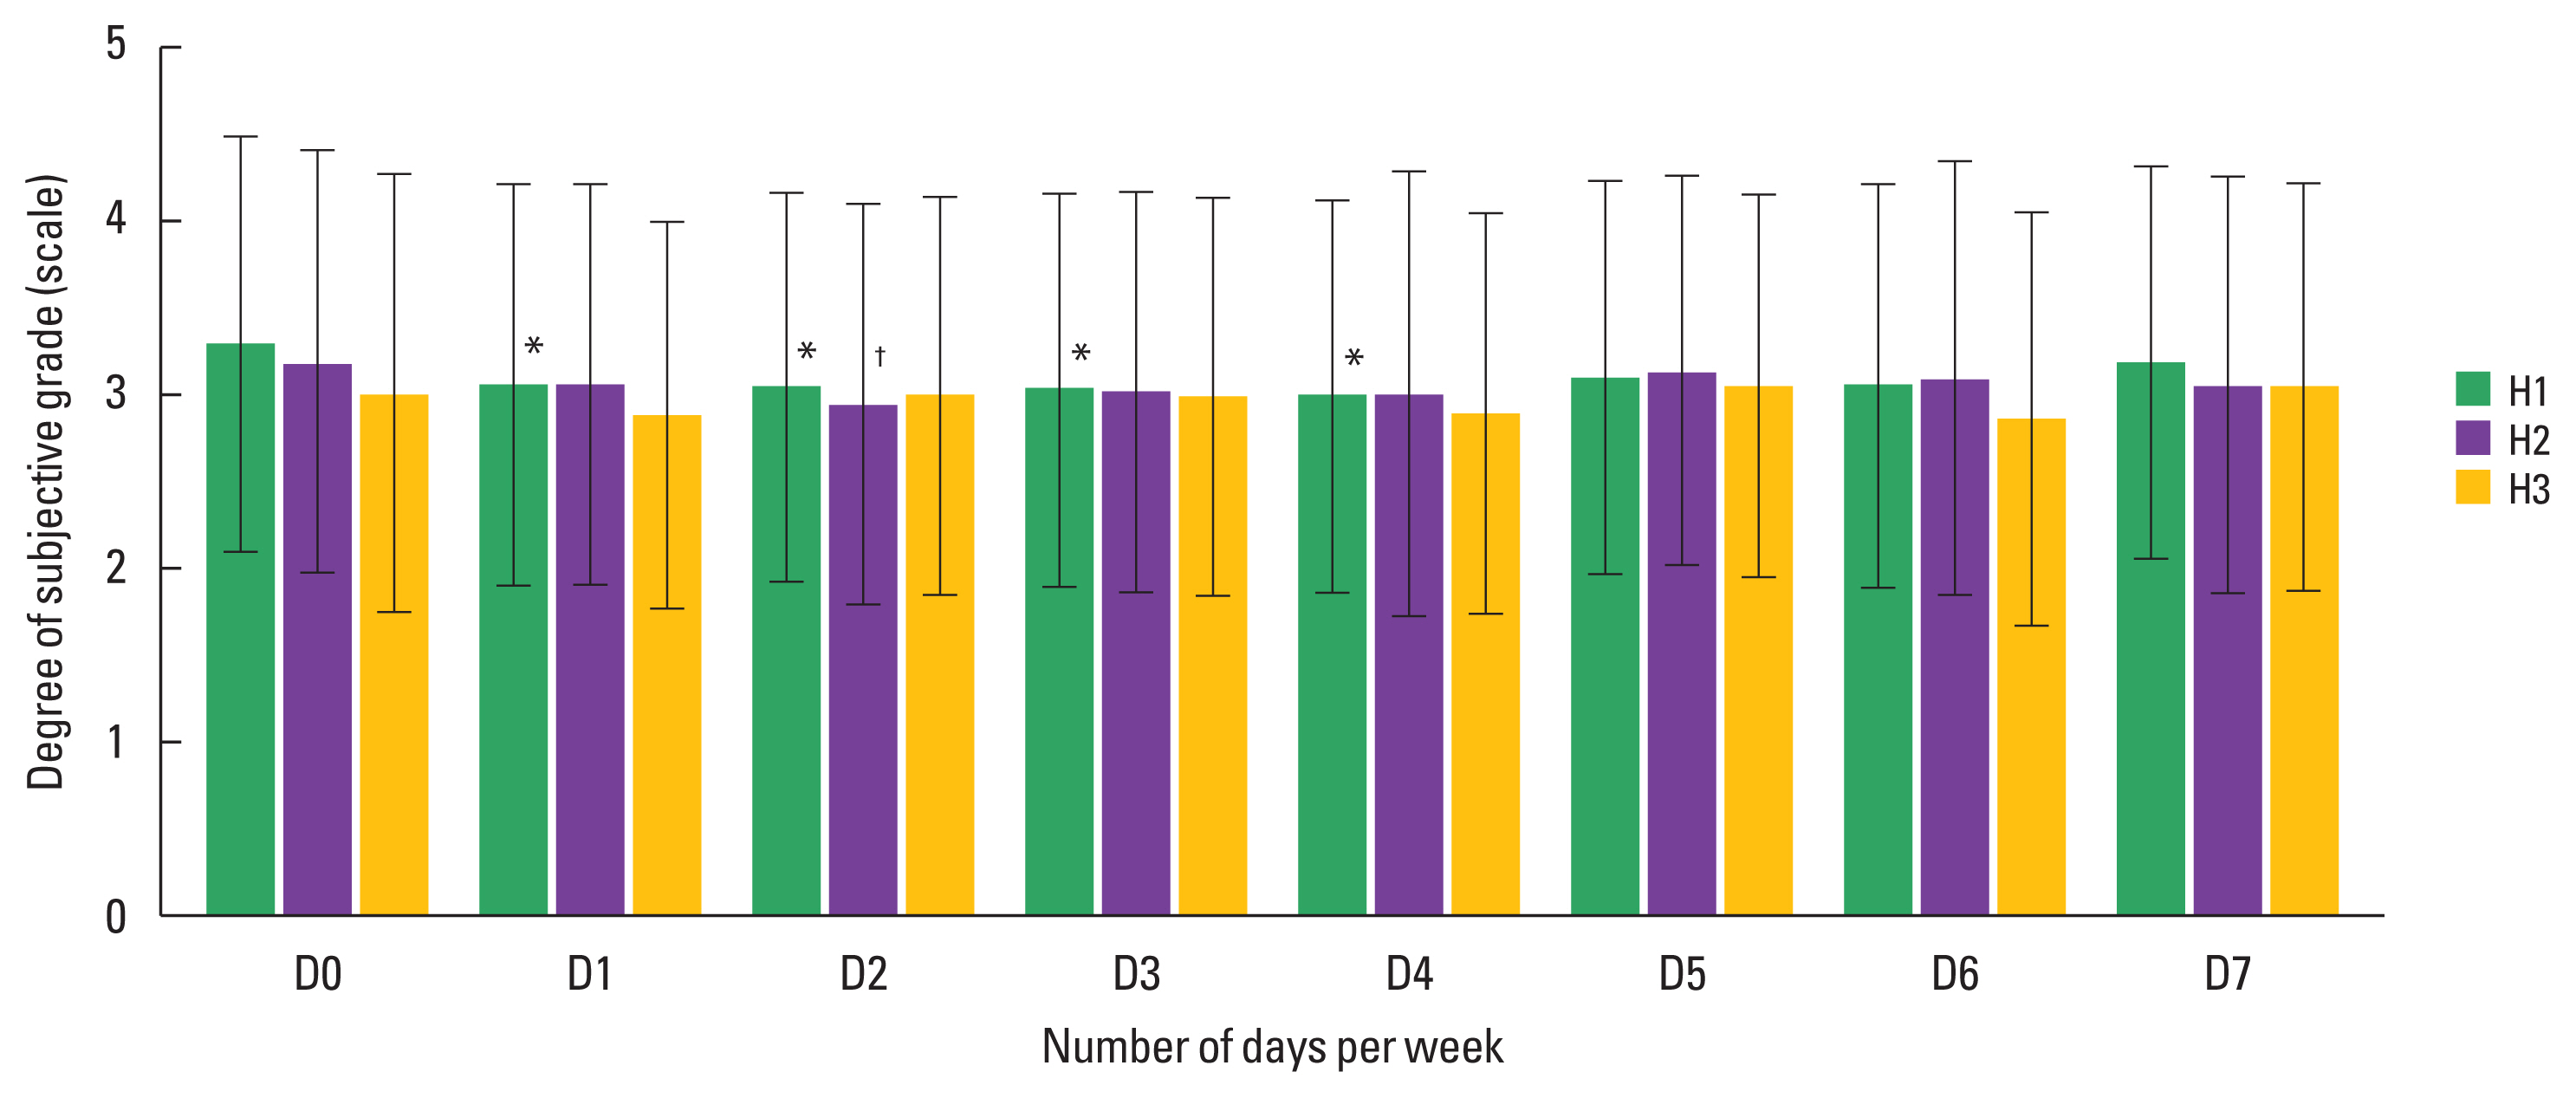
Subjective grades (scale ranges from 1 [good grade] to 5 [poor grade]) were compared between each grade level of SG and PG (Figs. 1 and 2). Mixed results were observed. In M1, mean % difference significantly reduced in PG than SG by −7.7% (*P<0.01).
In order to elucidate the effects of sedentary and PA lifestyle in adolescents, the degree of PA performed, and grades were further compared by the grade levels as shown on Figs. 1 and 2. That is, the days of performing PA of more than 60 min a day: D0 (0 day per week), D1 (1 day per week), D2 (2 days per week), D3 (3 days per week), D4 (4 days per week), D5 (5 days per week), D6 (6 days per week), and D7 (7 days per week).
As for M1, significant reductions in subjective grades were shown in D1 (2.60±1.06, *P<0.01), D2 (2.36±1.01, *P<0.01), D3 (2.41±1.05, *P<0.01), D4 (2.31±1.08, *P<0.01), D5 (2.34± 1.10, *P<0.01), D6 (2.28±1.05, *P<0.01), and D7 (2.28±1.14, *P<0.01) in compared to D0 (3.17±1.21). For M2, significant reductions in subjective grades were shown in D1 (3.01±1.20, P<0.01), D2 (2.80±1.14, *P<0.01), D3 (2.69±1.16, *P<0.01), D4 (2.67±1.22, *P<0.01), D5 (2.66±1.18, *P<0.01), D6 (2.54±1.13, *P<0.01), and D7 (2.77±1.26, *P<0.01) in comparison to D0 (3.17±1.21, *P<0.01).
For M3, significant reductions in subjective grades were shown in D1 (2.85±1.25, P=0.02), D2 (2.83±1.21, *P<0.01), D3 (2.65±1.17, *P<0.01), D4 (2.63±1.17, *P<0.01), D5 (2.80± 1.22, P<0.01), D6 (2.67±1.19, *P<0.01), and D7 (2.80±1.33, *P<0.01) in comparison to D0 (3.10±1.27). For H1, significant reductions in subjective grades were shown in D1 (3.06±1.16, *P=0.01), D2 (3.04±1.12, *P<0.01), D3 (3.03±1.13, *P<0.01), and D4 (2.99±1.13, *P<0.01) in comparison to D0 (3.28±1.20). For H2, significant reduction in subjective grades was shown in D2 (2.94±1.15, *P<0.01) in comparison to D0 (3.18±1.21).
Mental health by loneliness and stress
Mental state of the adolescents was also observed by the degree of loneliness (scale ranges 1 [never lonely] to 5 [always lonely]) between SG and PG (Table 5). The degree of loneliness of SG significantly increased in M3 (2.41±1.08, *P<0.01), H1 (2.50± 1.06, *P<0.01), H2 (2.46±1.02, *P<0.01), and H3 (2.43±1.08, *P<0.01) in comparison to M1 (2.18±0.99). The degree of loneliness of PG did not show significant changes between the grade levels. Significantly lower degrees of loneliness were observed between M1 (2.18±0.99 vs. 2.25±1.03, *P=0.04) and M2 (2.23± 1.02 vs. 2.34±1.04, *P<0.01) in SG in comparison to PG.
Degree of stress with scale from 1 (always) to 5 (no stress) was also observed. Significant reductions were shown in SG between M3 (2.78±0.97, *P<0.01), H1 (2.76±0.94, *P<0.01), H2 (2.74±0.97, *P<0.01), H3 (2.69±0.98, *P<0.01), and M1 (2.90± 0.96). Significant changes were not shown in PG. Significant difference was shown between SG and PG in H3 (2.69±0.98 vs. 2.85±1.01, *P<0.01).
DISCUSSION
The amount of and type of PA performed during young age is vital to lifetime physical and mental health. This study analyzed the changes in the amount and type of PA in sedentary and physically active Korean male adolescents by 6 grade levels. The amount of PA was further compared between SG (2 or less days of 60 min or more PA) and PG (3 or more days of 60 min or more PA) groups for the degree of subjective mental health (loneliness and stress) and academic performance (grade). Overall, PG performed more moderate and vigorous PA than SG. As the grade levels increased from 1 to 3 years of middle school and 1 to 3 years of high school, the amount of PA decreased in SG while no significant changes were observed in PG. This study showed that the decrease ranged from −3.2% to −21.3% during 6 years of secondary schools. A review on the decline in PA of adolescents showed continual decrease in the amount of PA throughout the grade levels. Such decrease was shown to steeply decline during the age of 15 by −17.1% (Farooq et al., 2020). Continual decrease in the amount of PA by adolescents were also reported by Kandola et al. (2020). The results indicate that as the grade increase, the amount of PA decrease. However, more physically active adolescents participate in more vigorous as well as moderate PA that those adolescents do not participate in more frequent PA regardless of the grade increase.
Among several variables related to mental health, this study chose loneliness as one of the important variables. Other similar variables that were reported with the loneliness showed similar pattern of significant worsening as the grade levels increased in SG. However, although significant worsening of loneliness was shown throughout the grade levels of M3 to H3 in comparison not M1, significant was only shown between H1 and M1. Although the prevalence of loneliness varies from region to region, Asian regions showed comparatively higher prevalence of loneliness. According to Surkalim et al. (2022), loneliness prevalence based on single item measures in adolescents age ranging from 12 to 17 showed the pooled prevalence of loneliness of 9.2% (95% confidence interval, 6.8% to 12.4%) in South-East Asia to 14.4% (12.2% to 17.1%) in the Eastern Mediterranean region. Such results were similar to the findings of this study. The degree of loneliness increased by more than 2 folds since M3 in comparison to M1. Moreover, significance was only shown between H1 to M1 in PG. These results indicate that regularly performed PA is related to lower degree of loneliness. Other studies also indicated that the mental health could be associated with regularly performed PA or increased sedentary lifestyle. According to Kandola et al. (2020), higher depression scores at older age of 18 years were associated with increased in sedentary behavior. PA has been known to promote mental health and treat mental health problems (Pascoe et al., 2020). Such trend can be observed from the results of the study. Similar patterns were also shown with the degree of stress in this study: PG showed less stress than SG as the grade level increased.
Subjective academic performance (grade) according to the days of PA performed per week showed significantly lower subjective academic performance or grade of PG for H2 and H3. The daily comparison showed similar results between SG and PG. It is believed that in a society such as Korea where the major goal of the adolescents is preparing for college exam and entrance, grade tend to be prioritized than PA (Park et al., 2020). However, the results of this study showed that significantly negative impact was not observed between PA and grade. That is, the amount of PA did seem to negatively influence subjective academic performance. Although some believe that participating in sports may negatively affect academic performance, many studies have reported contradictory results. For example, a study by Garcia and Subia (2019) reported increased motivation, study habits, and self-discipline, and academic performance by participating in school athletics. Garcia and Subia (2019) reported significant relationship (r=0.38, *P<0.01) between academic performance and school athletics participation (Garcia and Subia, 2019). A meta-analysis by Haverkamp and colleagues and a review by Singh and colleagues reported of significant improvements of several cognitive outcomes and language skills including academic performance through acute and chronic PA (Haverkamp et al., 2020; Singh et al., 2019).
The relationship between PA and mental health could vary. For example, vigorous PA showed mixed results in depression symptoms (Pascoe et al., 2020). However, many recent studies showed positive psychosocial outcomes including many internal and external mental health and academic achievement (Breslin et al., 2023; Spruit et al., 2016). Moreover, vigorous PA has been known to improve or maintain health and lower health care cost of adolescents (Torres et al., 2022). Globally renowned institutions in PA and health such as American College of Sports Medicine and World Health Organization recommend moderate-to-vigorous physical activity (MVPA) of 60 minutes or more every day of the week. (Farooq et al., 2020; Park, 2011; Van Hecke et al., 2016). Among the selected subjects, about 10% participated in PA daily and 17% did not participate in PA at all. The results of this study showed that PA could be beneficial to mental health as well as physical health in Korean male adolescents without negatively affecting academic performance as in other studies (Breslin et al., 2023; Erickson et al., 2019; Garcia and Subia, 2019). Interesting finding of this study was that the sitting duration. In both SG and PA, the sitting duration increased as the grade level increased. Such increasing sitting duration with increased grade level was also shown in Chinese adolescents (Li et al., 2022). However, SG and PA showed mixed results depending on the purpose of sitting. As reported by Li et al. (2022), ST increased for study purpose and decreased for nonstudy purpose in SG (Li et al., 2022). The sitting duration was overall longer for PG than SG when the purpose was to study while the sitting duration was overall longer for SG than PG when the purpose changed to nonstudy (Tables 3 and 4).
There were several limitations to this study. First, this study was conducted with a cross-sectional data instead of longitudinal data with same subjects per each grade levels. Although general trend could be observed from analysis of cross-sectional data, there may be many variations to PA and mental health. To promote PA in adolescents, more precise observations may be needed. Second limitation was that all the influencing factors could not be analyzed due to limited number of variants. Although sleeping variables were not included in this study, significant correlations were observed between mental health and sleeping patterns. Sleeping variables have been observed in other previous studies an influential factor in mental health in adolescents (Park, 2011; Sampasa-Kanyinga et al., 2020). Various factors including genetic, environmental, dietary, socioeconomic, developmental, behavioral, nutritional, metabolic, biochemical, and hormonal factors may influence health and growth in adolescents. Moreover, adolescents are more vulnerable to stressors (Mousikou et al., 2023). Careful consideration with various factors for promoting PA may be needed for healthy development of adolescents with lifetime consideration.
It is recommended that adolescent males should performed daily moderate to vigorous PA for proper growth and development as well as maintenance of lifetime health. The result of this study shows only about 11% of middle school and 8% of high school male adolescents perform more than 60 min of daily PA. According to the results, performing PA did not negatively influence academic performance. However, inactivity was related to negative mental health. Moreover, physically active subjects were more able to manage their ST for academic performance. Therefore, regular participation of PA by male adolescents is recommended for mental and physical health without negatively affecting academic performance.